

การเทรด
สำรวจตลาดที่หลากหลายด้วยราคาที่แข่งขันได้ สภาพคล่องสูง และเครื่องมือการเทรดขั้นสูง
เรียนรู้เพิ่มเติม 
แพลตฟอร์ม
เทรดอย่างไร้รอยต่อกับแพลตฟอร์มอันทรงพลังของ TMGM ที่สร้างขึ้นเพื่อความรวดเร็ว แม่นยำ และประสบการณ์การเทรดที่เหนือกว่า
เรียนรู้เพิ่มเติม แพลตฟอร์มการเทรด
เครื่องมือการเทรด
สถาบัน
เรียนรู้พื้นฐานการเทรดด้วยแหล่งข้อมูลสำหรับผู้เริ่มต้น รวมถึงคู่มือ สัมมนาออนไลน์ และข้อมูลเชิงลึกตลาด
เรียนรู้เพิ่มเติม ข่าว & วิเคราะห์
รับข้อมูลอัปเดตตลาดแบบเรียลไทม์และบทวิเคราะห์จากผู้เชี่ยวชาญเพื่อคว้าโอกาสการเทรดก่อนใคร
เรียนรู้เพิ่มเติม ข่าว & วิเคราะห์
เกี่ยวกับ
เรียนรู้สิ่งที่ทำให้ TMGM โดดเด่น — การดำเนินงานทั่วโลก ความแข็งแกร่งด้านการกำกับดูแล และความมุ่งมั่นสู่การสร้างสรรค์นวัตกรรมในการเทรด
เรียนรู้เพิ่มเติม ทำไมต้องเลือก TMGM
Stellar Price Forecast: XLM risks deeper losses as derivatives metrics turn negative
- Stellar price trades in red on Tuesday after a slight recovery on the previous day.
- Derivatives data caps the recovery, with XLM’s funding rates negative, short positions rising and falling open interest, signaling bearish sentiment.
- The broader technical structure remains under pressure, keeping the overall outlook tilted to the downside.
Stellar (XLM) is trading red below $0.16 at the time of writing on Tuesday, after a slight recovery the previous day. Weakening derivatives data caps the recovery, while an unfavorable technical outlook projects a deeper correction for the XLM token in the upcoming days.

Derivatives data shows bearish sentiment
Stellar’s derivatives metrics support a bearish bias. CoinGlass funding rate metric flipped to a negative rate on Monday and stands at -0.021% on Tuesday, nearing levels seen during the mid-February market dip. These negative rates indicate shorts are paying longs, suggesting bearish sentiment toward XLM.
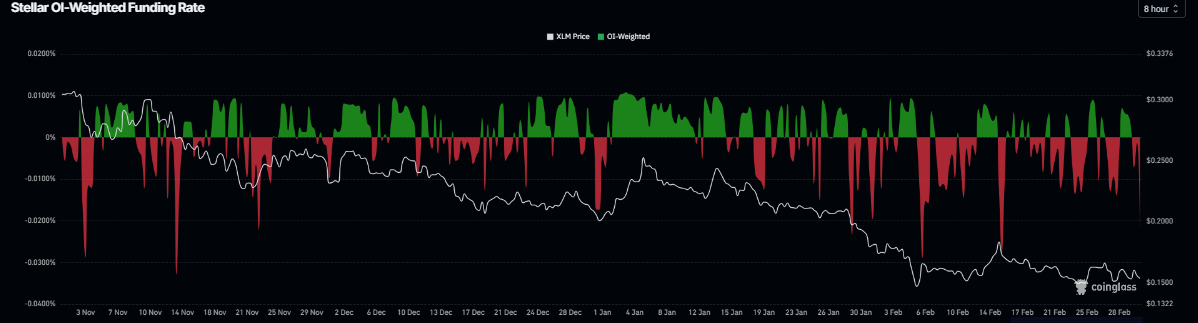
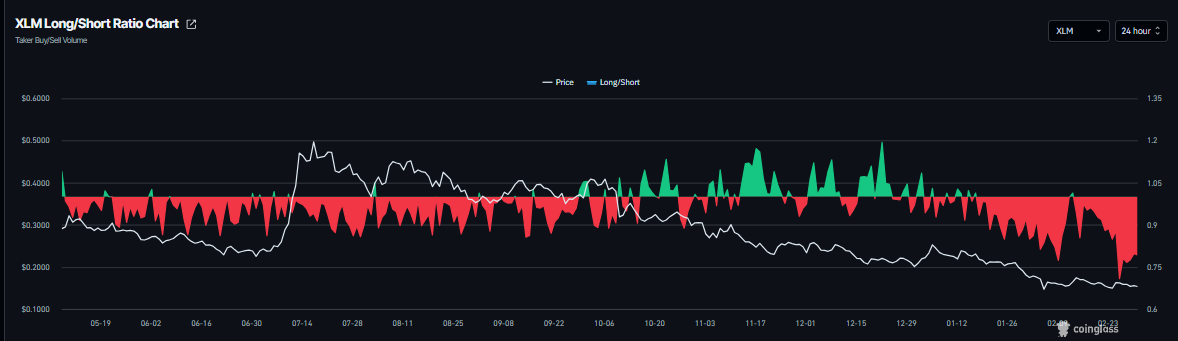
In addition, XLM’s long-to-short ratio stands at 0.79 on Tuesday, nearing its lowest level in over a month. This ratio below 1 indicates bearish sentiment as traders are betting on the Stellar price to fall.
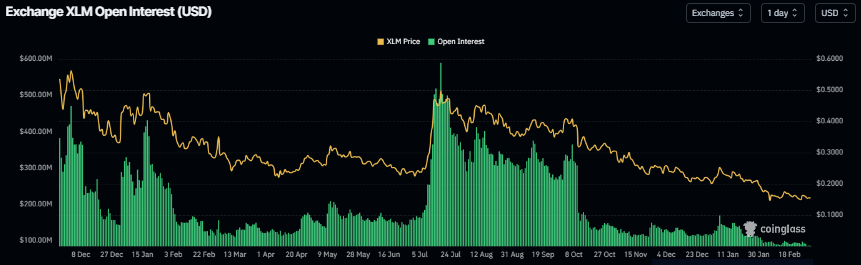
Stellar’s futures Open Interest (OI) falls to $84.87 million on Tuesday, having been steadily declining since early January and reaching levels not seen since mid-November 2024. This drop in OI reflects waning investor participation and projects a bearish outlook.
Stellar Price Forecast: XLM’s broader structure remains bearish
Stellar is trading at $0.15 as of writing on Tuesday. The near-term bias remains bearish, with price entrenched well below the 50-day and 100-day Exponential Moving Averages (EMAs), which continue to slope lower, underscoring a dominant downtrend.
The recent break back under the descending trend-line break area near $0.17 signals that sellers still control rebounds rather than a completed reversal. Momentum metrics echo this tone, as the Relative Strength Index (RSI) on the daily chart slips back toward the low-40s from mid-range readings while the Moving Average Convergence Divergence (MACD) indicator holds above the zero line but with a softening positive histogram, suggesting fading upside pressure within a broader bearish structure.
Immediate resistance aligns at $0.16, where recent highs converge with the broken trend-line region, followed by stronger resistance at the 23.6% Fibonacci retracement of the $0.13–$0.25 slide at $0.16 and then the 38.2% retracement at $0.18, which also sits near the last reaction peak.
On the downside, initial support emerges around $0.15, with a break exposing the prior swing low near $0.14 and then the Fibonacci origin zone toward $0.14–$0.13. As long as XLM remains capped below $0.16–$0.18, rallies would face supply, and the risk of a retest of the lower supports stays elevated.
(The technical analysis of this story was written with the help of an AI tool.)
บทความยอดนิยม
1ฟรังก์สวิสร่วงเกือบ 1% ขณะดอลลาร์สหรัฐแตะระดับสูงสุดใหม่ของปี2คาดการณ์ดัชนีดอลลาร์สหรัฐ: DXY แตะระดับสูงสุดใหม่ของปีหลังทะลุกรอบรูปแบบธงขาขึ้น3ดอลลาร์นิวซีแลนด์ร่วงลง ขณะฝ่ายหนุนคุมเข้มของเฟดกลับมามีอิทธิพลอีกครั้ง4คาดการณ์ราคา Pump.fun: PUMP ปรับตัวขึ้น แม้ความต้องการจากนักลงทุนรายย่อยยังซบเซา5ราคาโลหะเงินสวนทางอัตราผลตอบแทนพันธบัตรสหรัฐที่ปรับขึ้น ทะลุ 52 ดอลลาร์ แม้ตลาดคาดการณ์เฟดขึ้นดอกเบี้ย6ปอนด์อังกฤษร่วงหลุด 1.33 หลังเงินเฟ้อ CPI สหรัฐสูง และเฟดส่งสัญญาณคุมเข้มนโยบายการเงิน7ดอลลาร์ออสเตรเลียอ่อนค่าเข้าใกล้ระดับต่ำสุดของเดือนมีนาคม ขณะแนวโน้มนโยบายเฟดและธนาคารกลางออสเตรเลียแตกต่างกัน8เงินเยนญี่ปุ่นร่วงแตะระดับต่ำสุดในรอบสิบสัปดาห์ ขณะที่ USD/JPY ทะลุ 159.009ดอลลาร์สหรัฐ: ปัจจัยพื้นฐานที่เอื้ออำนวยช่วยชดเชยความกังวลเรื่องการขาดดุล – Rabobank



เชื่อมต่อกับเรา









ติดต่อเรา
โทร: +61 2 8036 8388
แฟกซ์: +61 2 8036 8388
อีเมล: support@tmgm.com
เว็บไซต์: https://www.tmgmasia.com



ข้อมูลที่ให้ไว้บนเว็บไซต์นี้มีลักษณะเป็นข้อมูลทั่วไปเท่านั้น และไม่ถือเป็นคำแนะนำทางการเงินส่วนบุคคล ก่อนดำเนินการใด ๆ ตามข้อมูลบนเว็บไซต์นี้ คุณควรพิจารณาความเหมาะสมของข้อมูลดังกล่าวให้สอดคล้องกับวัตถุประสงค์ สถานะทางการเงิน และความต้องการของคุณ การลงทุนใน CFD และสัญญา FX Margin มีความเสี่ยงอย่างมีนัยสำคัญ และไม่เหมาะสำหรับนักลงทุนทุกคน คุณอาจสูญเสียเงินมากกว่าเงินฝากเริ่มต้นของคุณ คุณไม่ได้เป็นเจ้าของ หรือมีส่วนได้เสียใด ๆ ในสินทรัพย์อ้างอิง เราแนะนำให้คุณขอคำแนะนำอย่างเป็นอิสระ และตรวจสอบให้แน่ใจว่าคุณเข้าใจความเสี่ยงที่เกี่ยวข้องอย่างถ่องแท้ก่อนทำการซื้อขาย สิ่งสำคัญคือคุณต้องอ่านและพิจารณาเอกสารการเปิดเผยข้อมูลก่อนที่คุณจะได้มาซึ่งผลิตภัณฑ์ใด ๆ ที่ระบุไว้บนเว็บไซต์ ข้อมูลและโฆษณาที่นำเสนอบนเว็บไซต์นี้ไม่ได้มีวัตถุประสงค์เพื่อให้บุคคลใด ๆ ในประเทศหรือเขตอำนาจศาลใด ๆ ใช้งาน หากการใช้งานดังกล่าวขัดต่อกฎหมายและข้อบังคับท้องถิ่น ผลิตภัณฑ์และบริการที่นำเสนอบนเว็บไซต์นี้ไม่ได้มีไว้สำหรับผู้พำนักอาศัยในสหรัฐอเมริกา มาเลเซีย และประเทศไทย
TMGM ได้รับอนุญาตและอยู่ภายใต้การกำกับดูแลในหลายเขตอำนาจศาล
Trademax Australia Limited ซึ่งดำเนินธุรกิจในชื่อ TMGM ได้รับการกำกับดูแลโดย Australian Securities and Investments Commission (ASIC) หมายเลขใบอนุญาต AFSL 436416 และตั้งอยู่ที่ Level 28, One International Tower, 100 Barangaroo Avenue, 2000 Sydney, NSW Australia.
อีเมล: support@tmgm.com.au
Trademax Global Limited ซึ่งดำเนินธุรกิจในชื่อ TMGM ได้รับอนุญาตและอยู่ภายใต้การกำกับดูแลโดย Vanuatu Financial Services Commission (VFSC) หมายเลขทะเบียน 40356 และจดทะเบียนที่ 1276, Kumul Highway, Port Vila, Vanuatu, Republic of Vanuatu.
อีเมล: support@tmgm.com
Trademax Global Markets (SE) Limited, ดำเนินการภายใต้ชื่อ TMGM, ได้รับอนุญาตและอยู่ภายใต้การกำกับดูแลโดย Financial Services Authority (FSA) ของเซเชลส์ ภายใต้เลขที่ใบอนุญาต SD224 บริษัทจดทะเบียนที่ สำนักงานเลขที่ 13, Providence Estate ABIS Centre, เกาะมาเฮ, เซเชลส์
อีเมล: support@tmgm.com
Trademax Global Markets (International) Pty Ltd ซึ่งดำเนินธุรกิจในชื่อ TMGM ได้รับอนุญาตและอยู่ภายใต้การกำกับดูแลโดย Financial Services Commission, Mauritius (FSC) หมายเลขใบอนุญาต GB22201012 และจดทะเบียนที่ 33, Edith Cavell Street C/o IQ EQ Fund Services (Mauritius) Ltd Port Louis, 11324 Mauritius.
อีเมล: support@tmgm.com
ลิขสิทธิ์ © TMGM สงวนลิขสิทธิ์ทั้งหมด