

Trading
Explore a wide range of markets with competitive pricing, deep liquidity, and advanced trading tools.
Learn More 
Platform
Trade seamlessly with TMGM's powerful platform, built for speed, precision, and a superior trading experience.
Learn More Trading Platform
Academy
Learn the fundamentals of trading with beginner-friendly resources, including guides, webinars, and market insights.
Learn More News & Analysis
Get real-time market updates and expert analysis to stay ahead of trading opportunities
Learn More News & Analysis
About
Learn what sets TMGM apart — our global presence, regulatory strength, and commitment to innovation in trading.
Learn More Why Choose TMGM
Sponsorship
British Pound finds relief as USD pauses, but inflation risks linger
- GBP/USD rebounds from 1.3209 as Dollar rally pauses.
- UK energy shock lifts expectations for further BoE tightening.
- Rising US inflation expectations keep Treasury yields elevated.
The Pound Sterling trims some of its weekly losses, gaining over 0.18% against the US Dollar on Friday as the US Dollar takes a breather, even as US Treasury yields continue to rise. The jump in energy prices, spurred by the Middle East conflict, and increased Fed hawkish bets for the remainder of 2026. The GBP/USD trades at 1.3243 after bouncing off daily lows of 1.3209.

GBP/USD rebounds as BoE hike bets offset persistent global yield pressure
Geopolitics continue to drive market sentiment. Even though newswires reported a potential US-Iran phased deal, officials on both sides, particularly Iranian delivered harsh comments, threatening to use “different weapons” in the case of another attack. Most US officials were focused on Chinese President Xi Jinping's visit to the US.
US President Trump said that he had a very productive meeting with Xi. The Chinese President said that the US Trip was very successful and that he sees a brighter US-China future.
Data-wise, the University of Michigan Consumer Sentiment Index for September fell to a four-month low due to rising inflation concerns, which are eroding households' purchasing power. The index fell from 51.7 in August to 48.1 in September. Inflation expectations for one year rose from 4% to 4.6%, and for a five to ten-year period, ticked up from 3.3% to 3.4%.
Other data showed that core Durable Goods Orders rose above estimates in August, while July data was upwardly revised, indicating robust business spending.
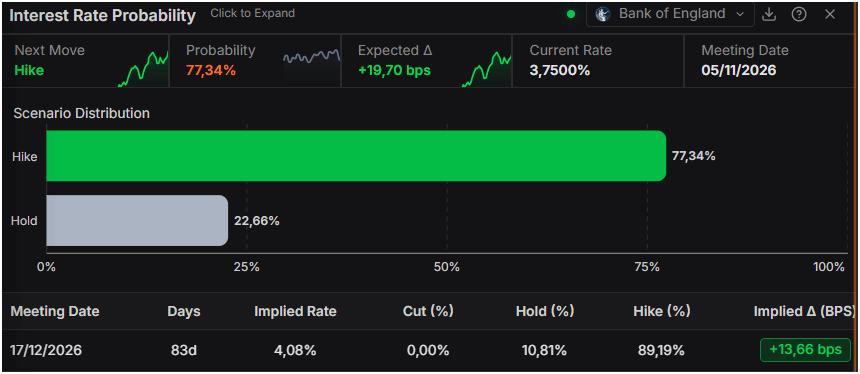
In the UK, the jump in Oil prices increased inflationary pressures, pushing investors to price in further tightening by the Bank of England (BoE). Last week, the BoE held rates unchanged but opened the door for rate hikes if inflation continues to surge.
Traders in money markets expect 33 basis points of monetary tightening from the BoE this year, with the odds of a move at the November meeting at 77%, according to Prime Terminal. For 2027, investors eye 105 basis points of tightening by the central bank.
GBP/USD Price Forecast: Technical outlook
In the daily chart, GBP/USD trades at 1.3243, retaining a bearish near‑term bias as spot remains below the latest simple moving average triple around 1.3466 and under a series of broken upward trend lines, which now act as overhead reference at 1.3516 and 1.3723. The downward resistance trend line that previously broke near 1.3329 continues to cap recovery attempts, while the Relative Strength Index (14) at 28.4 slips into oversold territory, hinting that while selling pressure dominates, the downside could start to lose momentum tactically.
On the topside, initial resistance emerges at the prior downtrend break around 1.3329, followed by the more recent descending trend‑line break near 1.3444 and the clustered simple moving averages at 1.3466, which reinforce a dense supply area before the former support trend lines at 1.3516 and 1.3723. With no clear structural support levels mapped below the current price in this dataset, traders may instead look to psychological round figures and previous swing lows on the chart as potential demand zones until the pair can reclaim the 1.3329 area and start neutralizing the prevailing bearish structure.
(The technical analysis of this story was written with the help of an AI tool. Know more.)
Pound Sterling Price This week
The table below shows the percentage change of British Pound (GBP) against listed major currencies this week. British Pound was the strongest against the Australian Dollar.
| USD | EUR | GBP | JPY | CAD | AUD | NZD | CHF | |
|---|---|---|---|---|---|---|---|---|
| USD | 0.76% | 1.11% | 0.27% | 1.07% | 1.26% | 1.06% | 0.76% | |
| EUR | -0.76% | 0.37% | -0.47% | 0.31% | 0.50% | 0.31% | 0.00% | |
| GBP | -1.11% | -0.37% | -0.94% | -0.05% | 0.13% | -0.06% | -0.36% | |
| JPY | -0.27% | 0.47% | 0.94% | 0.83% | 0.97% | 0.80% | 0.50% | |
| CAD | -1.07% | -0.31% | 0.05% | -0.83% | 0.24% | -0.03% | -0.31% | |
| AUD | -1.26% | -0.50% | -0.13% | -0.97% | -0.24% | -0.19% | -0.56% | |
| NZD | -1.06% | -0.31% | 0.06% | -0.80% | 0.03% | 0.19% | -0.30% | |
| CHF | -0.76% | -0.00% | 0.36% | -0.50% | 0.31% | 0.56% | 0.30% |
The heat map shows percentage changes of major currencies against each other. The base currency is picked from the left column, while the quote currency is picked from the top row. For example, if you pick the British Pound from the left column and move along the horizontal line to the US Dollar, the percentage change displayed in the box will represent GBP (base)/USD (quote).
Top Articles
1New Zealand Dollar holds steady as US Dollar retreats2Dow Jones Industrial Average bounces on Iran's latest Hormuz offer3Bitcoin/Gold Outlook: BTC falls below $84K support as XAU/USD remains under pressure4British Pound finds relief as USD pauses, but inflation risks linger5Canadian Dollar: Undervalued near 1.41 against US Dollar – Scotiabank6Euro: Correction seen near key averages against US Dollar – Societe Generale7Euro set for third weekly decline as hawkish Federal Reserve outlook weighs8Australian Dollar: RBA hike expectations shape outlook – ING9US Dollar: Yields support Greenback strength – OCBC
LIVE QUOTES

Get Started!
Sign up and access the Global Markets in less than 3 minutes

Connect With Us









Contacts
Phone: +61 2 8036 8388
Fax: +61 2 8036 8388
Email: support@tmgm.com



The information provided on this website is of a general nature only and does not constitute personal financial advice. Before acting on any information on this website, you should consider the suitability of the information in relation to your objectives, financial situation and needs. Investing in CFDs and FX Margin Contracts carries significant risks and is not suitable for all investors. You may lose more than your initial deposit. You do not own, or have, any interest in the underlying asset. We recommend that you seek independent advice and ensure you fully understand the risks involved before trading. It is important that you read and consider the disclosure document before you acquire any product listed on the website. The information and advertisements offered on this website are not intended for use by any person in any country or jurisdiction where such use would be contrary to local laws and regulations. The Products and Services offered on this website are not intended for residents of the United States, Malaysia and Thailand.
TMGM is authorized and regulated in various jurisdictions.
Trademax Australia Limited, trading as TMGM, is regulated by the Australian Securities and Investments Commission (ASIC), AFSL no. 436416 and is located at Level 28, One International Tower, 100 Barangaroo Avenue, 2000 Sydney, NSW Australia.
Email: support@tmgm.com.au
Trademax Global Limited, trading as TMGM, is authorized and regulated by the Vanuatu Financial Services Commission (VFSC), registration number 40356 and registered at 1276, Kumul Highway, Port Vila, Vanuatu, Republic of Vanuatu.
Email: support@tmgm.com
Trademax Global Markets (SE) Limited, trading as TMGM, is authorized and regulated by the Financial Services Authority (FSA) of Seychelles, with license number SD224. The company is registered at Office No 13, Providence Estate ABIS Centre, Mahe, Seychelles.
Email: support@tmgm.com
Trademax Global Markets (International) Pty Ltd, trading as TMGM, is authorized and regulated by the Financial Services Commission, Mauritius (FSC) with license no. GB22201012, and registered at 33, Edith Cavell Street C/o IQ EQ Fund Services (Mauritius) Ltd Port Louis, 11324 Mauritius.
Email: support@tmgm.com
Copyright © TMGM. All rights reserved