

Trading
Explore a wide range of markets with competitive pricing, deep liquidity, and advanced trading tools.
Learn More 
Platform
Trade seamlessly with TMGM's powerful platform, built for speed, precision, and a superior trading experience.
Learn More Trading Platform
Academy
Learn the fundamentals of trading with beginner-friendly resources, including guides, webinars, and market insights.
Learn More News & Analysis
Get real-time market updates and expert analysis to stay ahead of trading opportunities
Learn More News & Analysis
About
Learn what sets TMGM apart — our global presence, regulatory strength, and commitment to innovation in trading.
Learn More Why Choose TMGM
Sponsorship
Cardano Price Forecast: ADA tumbles below $0.25 as retail participation dips
- Cardano logs three straight days of declines, with the price sliding below $0.2500 on Thursday.
- Weakening demand for ADA derivatives drives perpetual futures Open Interest and trading volume down.
- Technically, Cardano is supported by major moving averages, but downtrending momentum indicators cap recovery potential.
Cardano's (ADA) technical structure is shifting on Thursday, resulting in sustained losses for three straight days. The token remains below the pivotal $0.2500 level after a sharp decline of more than 10%, and trades below $0.2300 at the time of writing, weighed down by softening momentum indicators. Meanwhile, near-term support remains structurally solid, reinforced by major moving averages.

Cardano derivatives face outflows
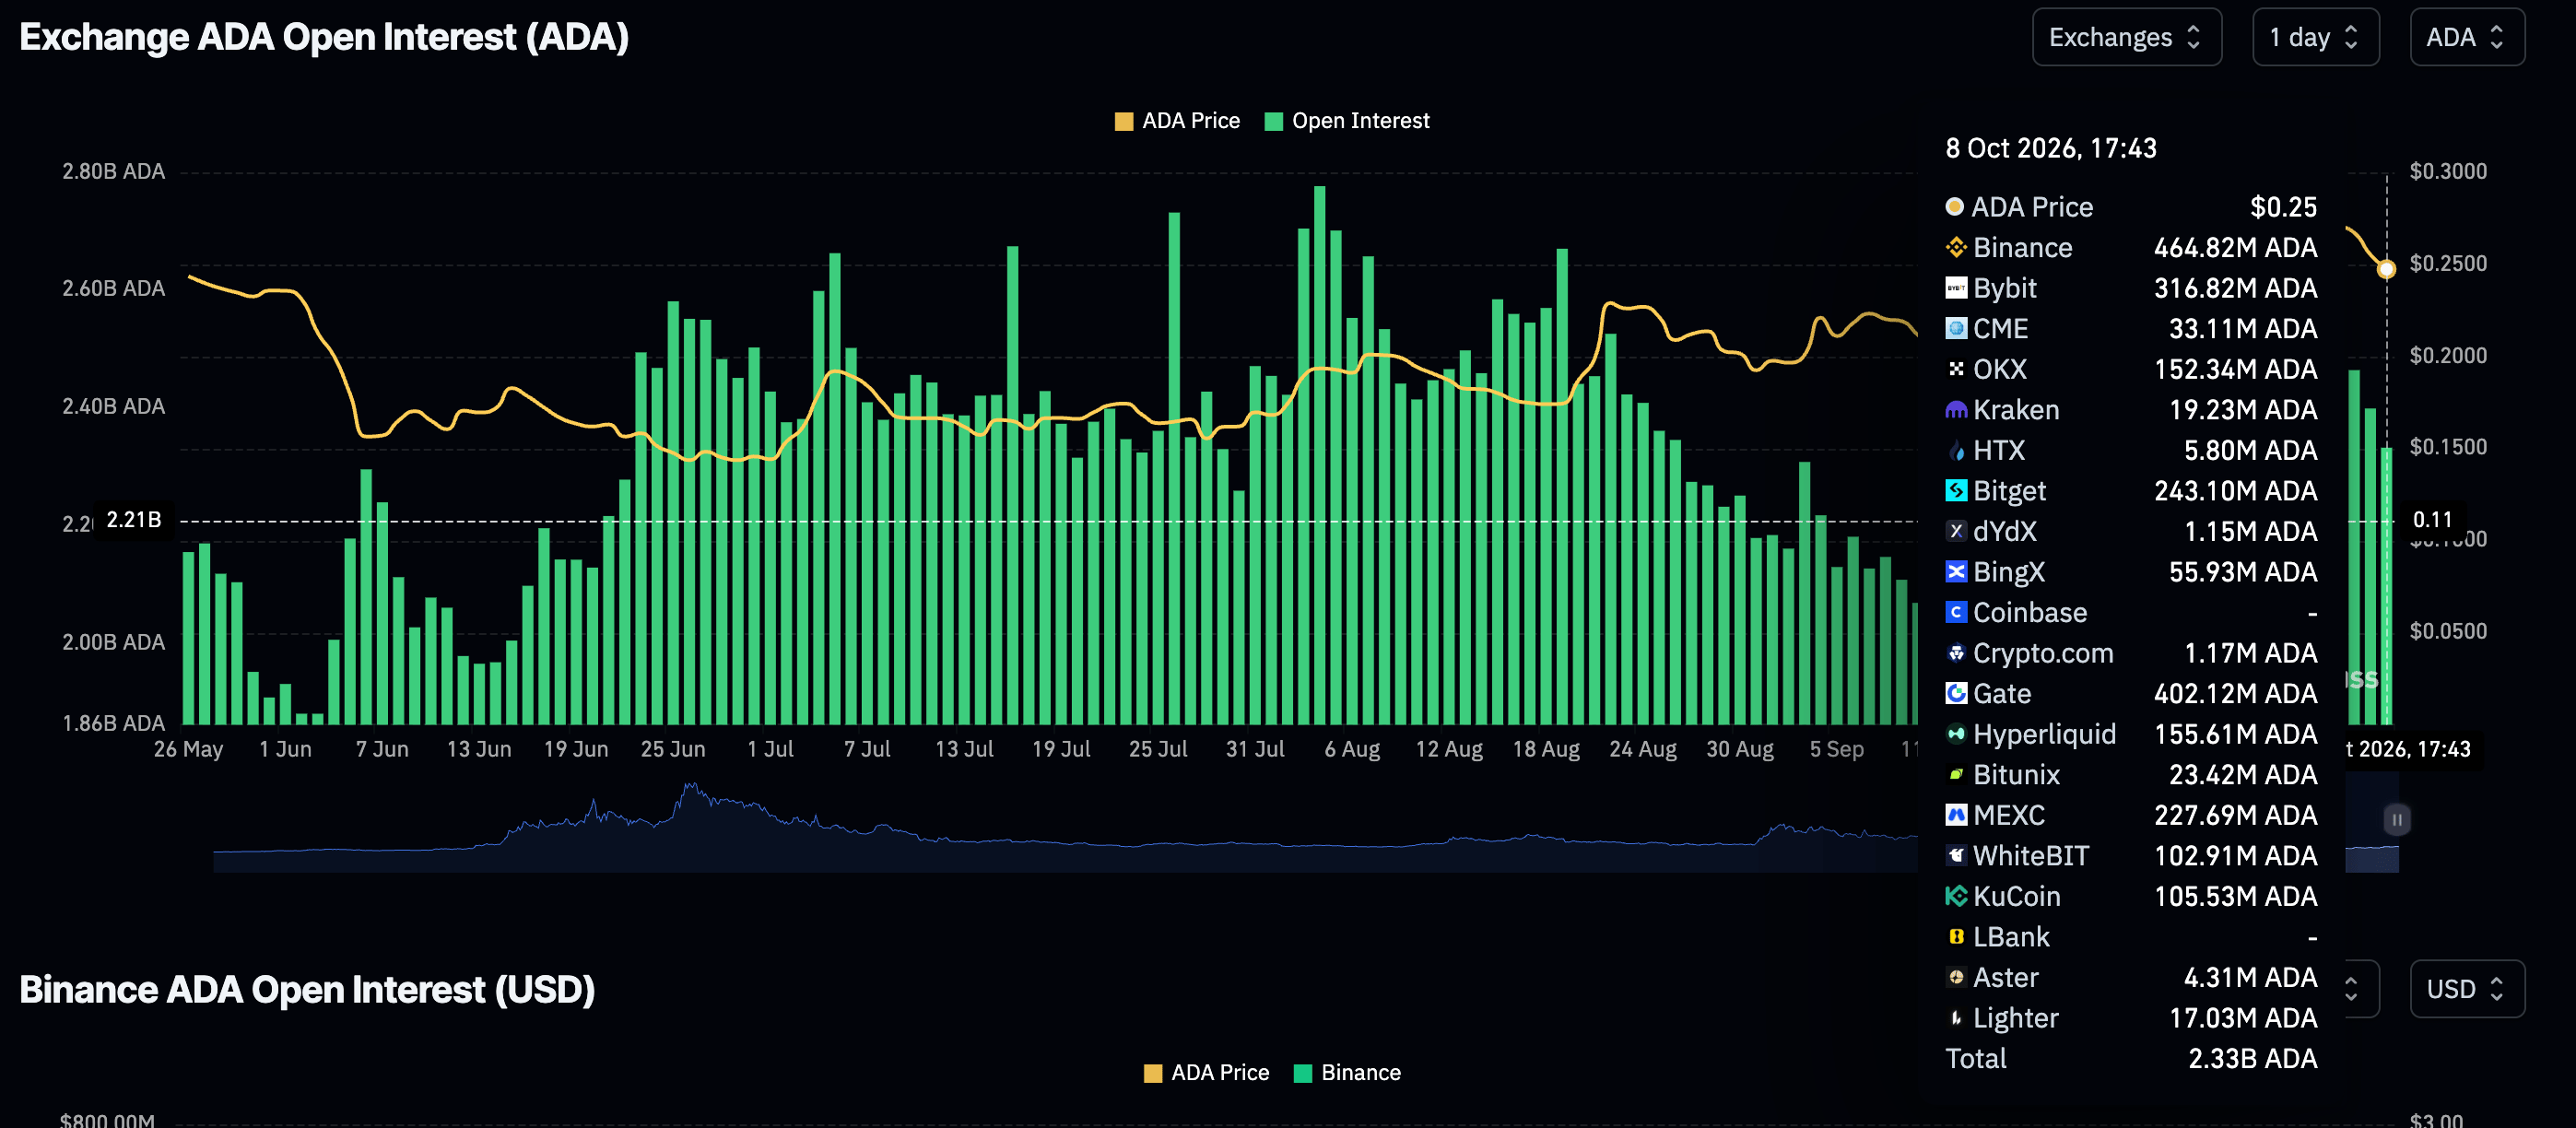
The Cardano derivatives market signals a fading outlook, as perpetual futures Open Interest (OI) fell to 2.3 billion ADA on Thursday, down from 2.5 billion ADA the previous day. This cool-down aligns with broad sell-side pressure witnessed in the spot market and dims Cardano’s recovery potential, especially if it is sustained.
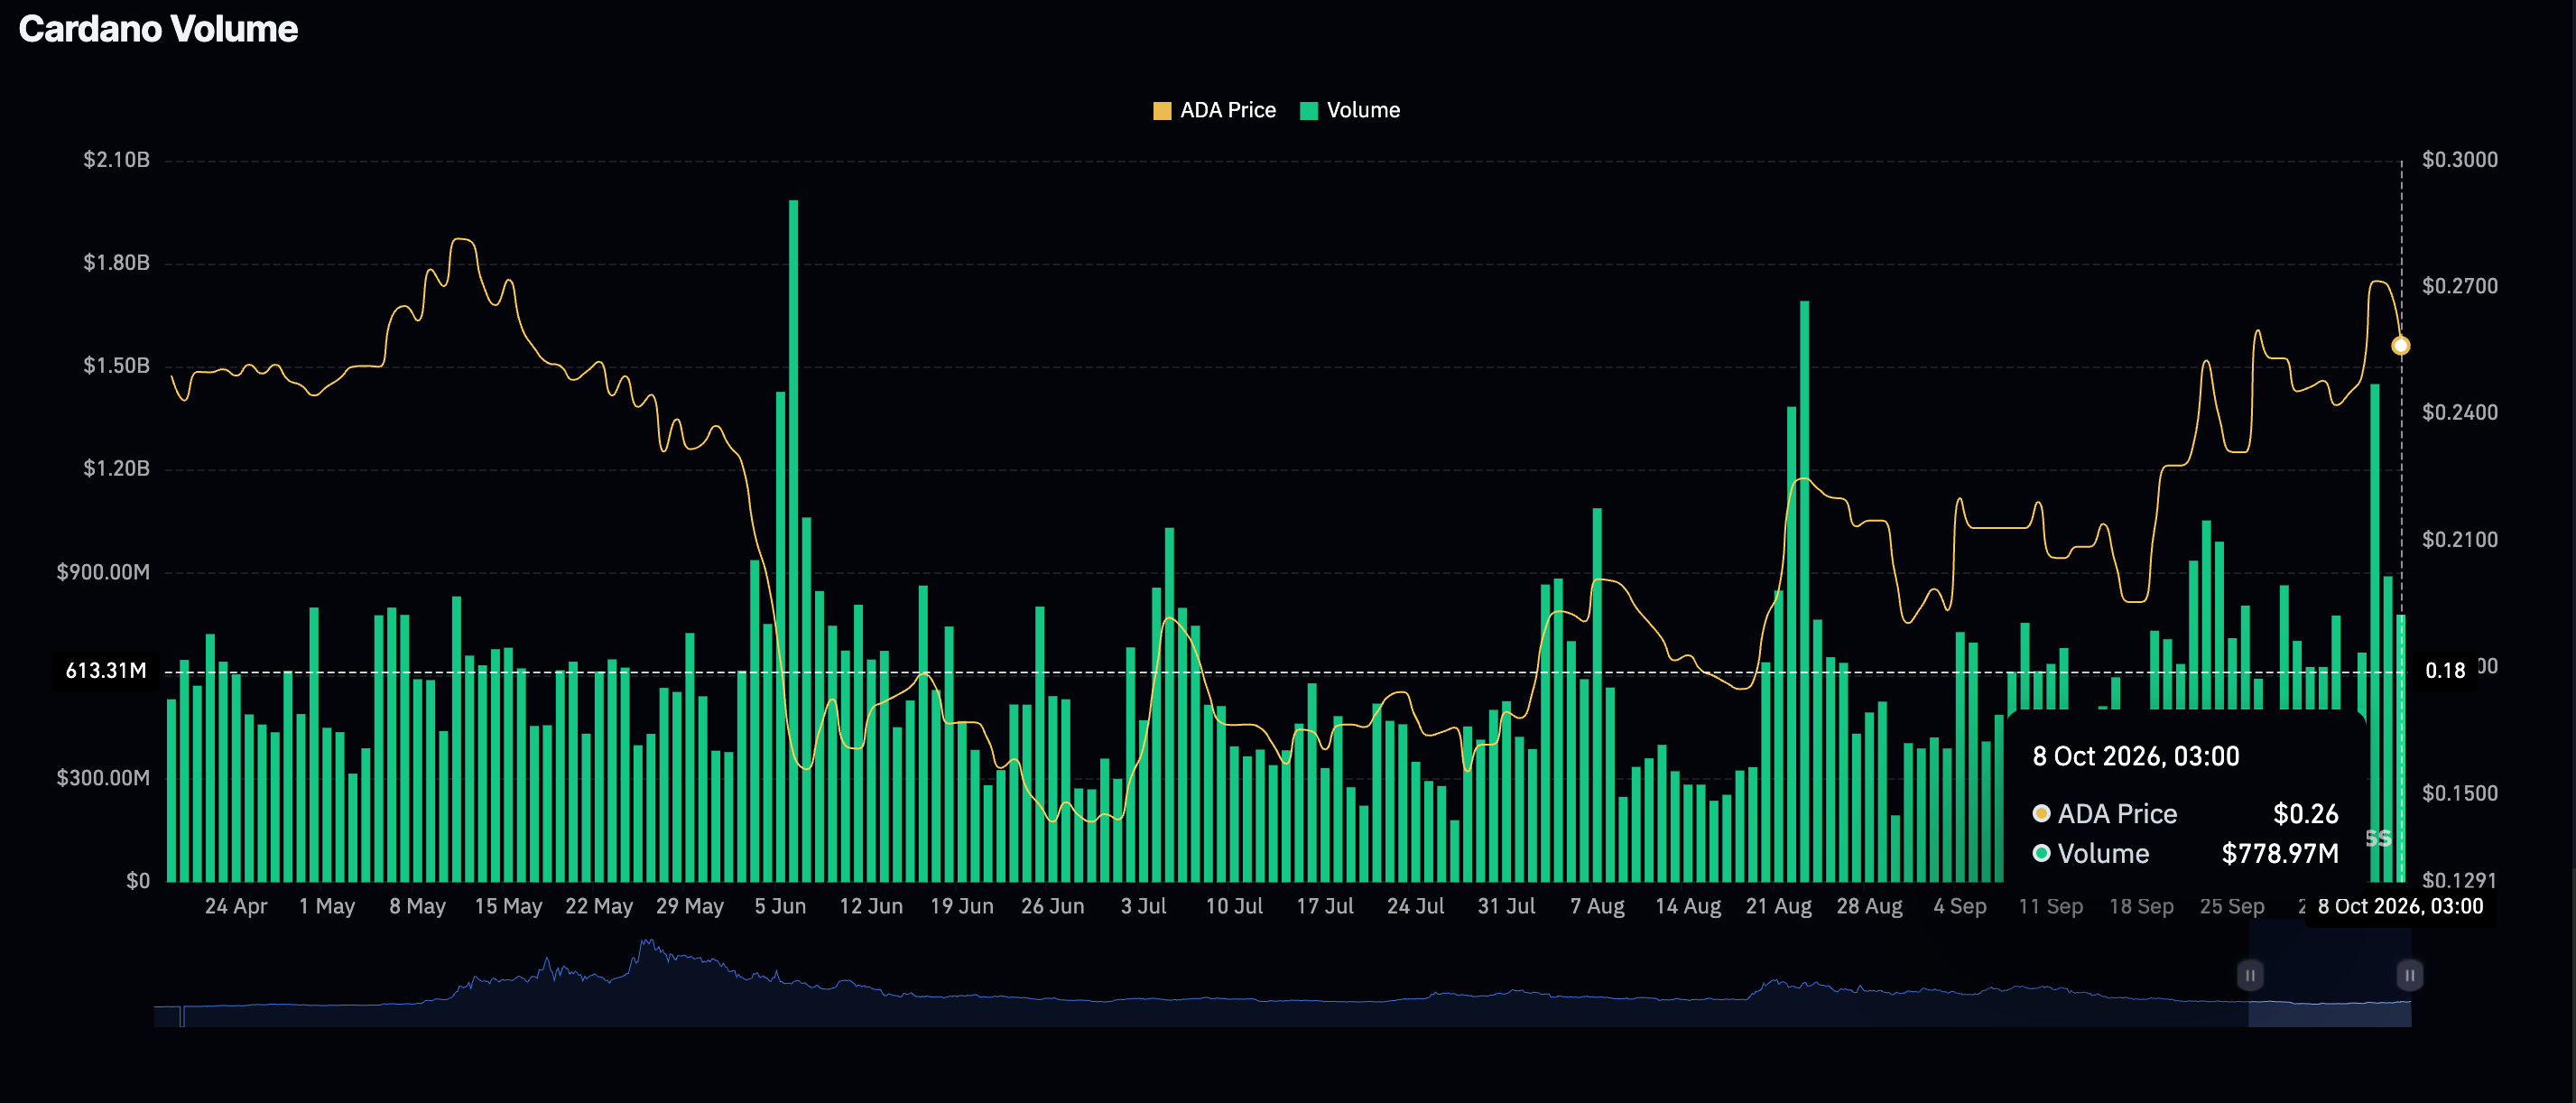
A notable drop in trading volume reinforces the notion of shrinking retail participation. Volume, according to CoinGlass data, stands at $779 million on Thursday, down from $890 million the day before and $1.45 billion on Tuesday.
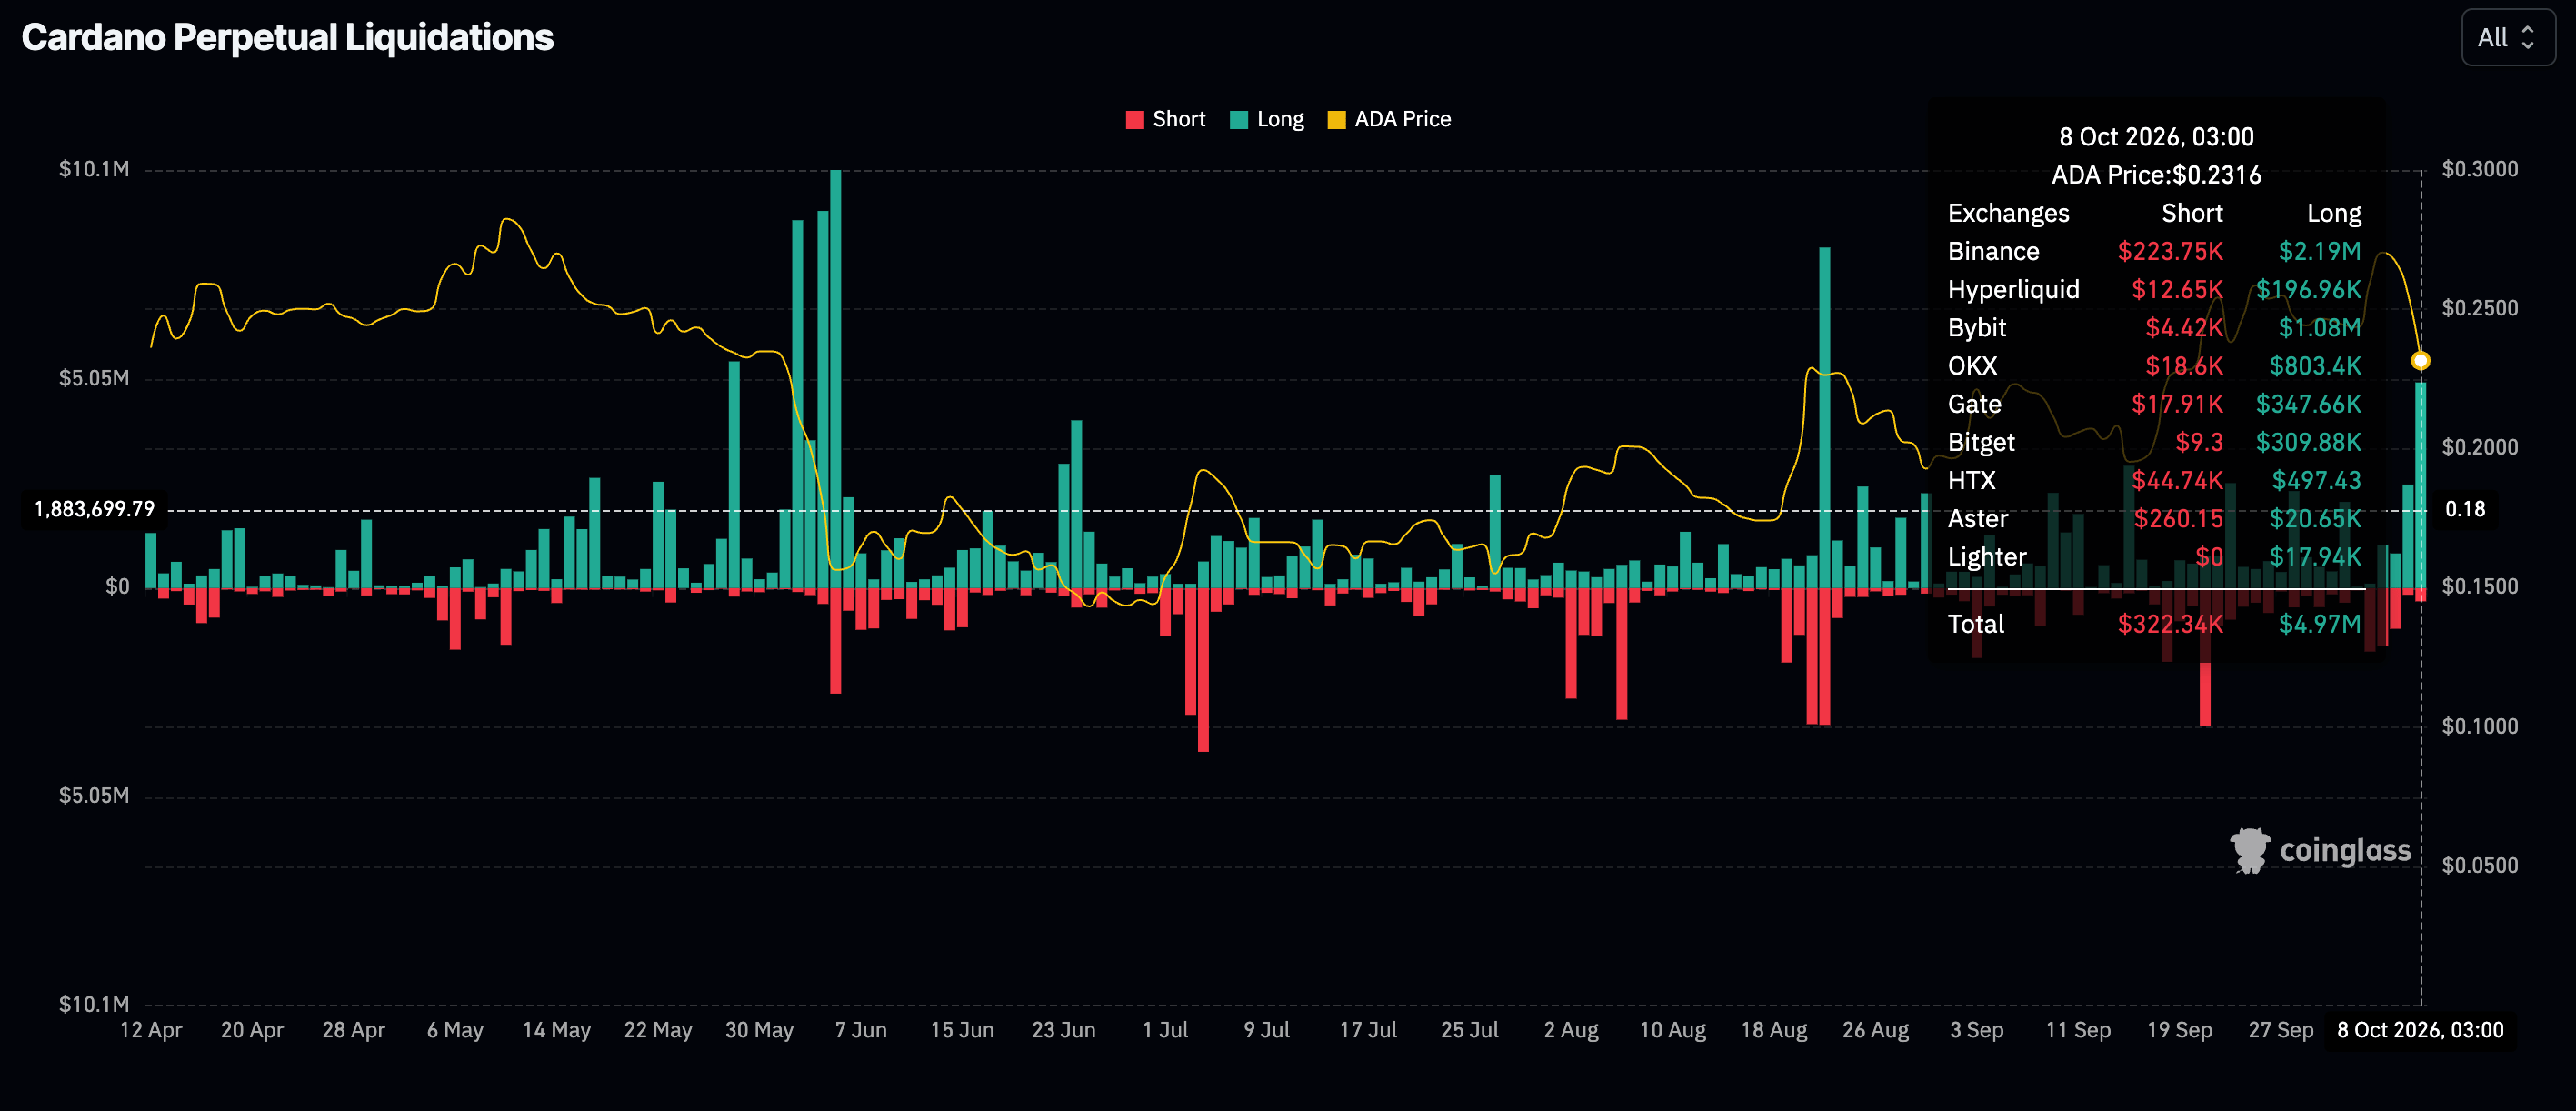
The sticky sell-side pressure this week has left many traders coating losses, including roughly $5 million in liquidated long positions compared to only $322,000 in short positions. An extended decline may continue to push more long traders to the edge and into deeper losses through forced selling.
Technical analysis: ADA headwinds put recovery at risk
Cardano falls for the third straight day and trades below $0.2300, aligning with broader crypto market headwinds this week. Still, the pair holds above a dense bullish structure, with price above the 50-day, 100-day, and 200-day Exponential Moving Averages (EMAs), while the SuperTrend line at $0.2243 reinforces the underlying demand area.
The Relative Strength Index (RSI) at 44 leans bearish, and the Moving Average Convergence Divergence (MACD) has slipped below zero, hinting that momentum is increasingly bearish.
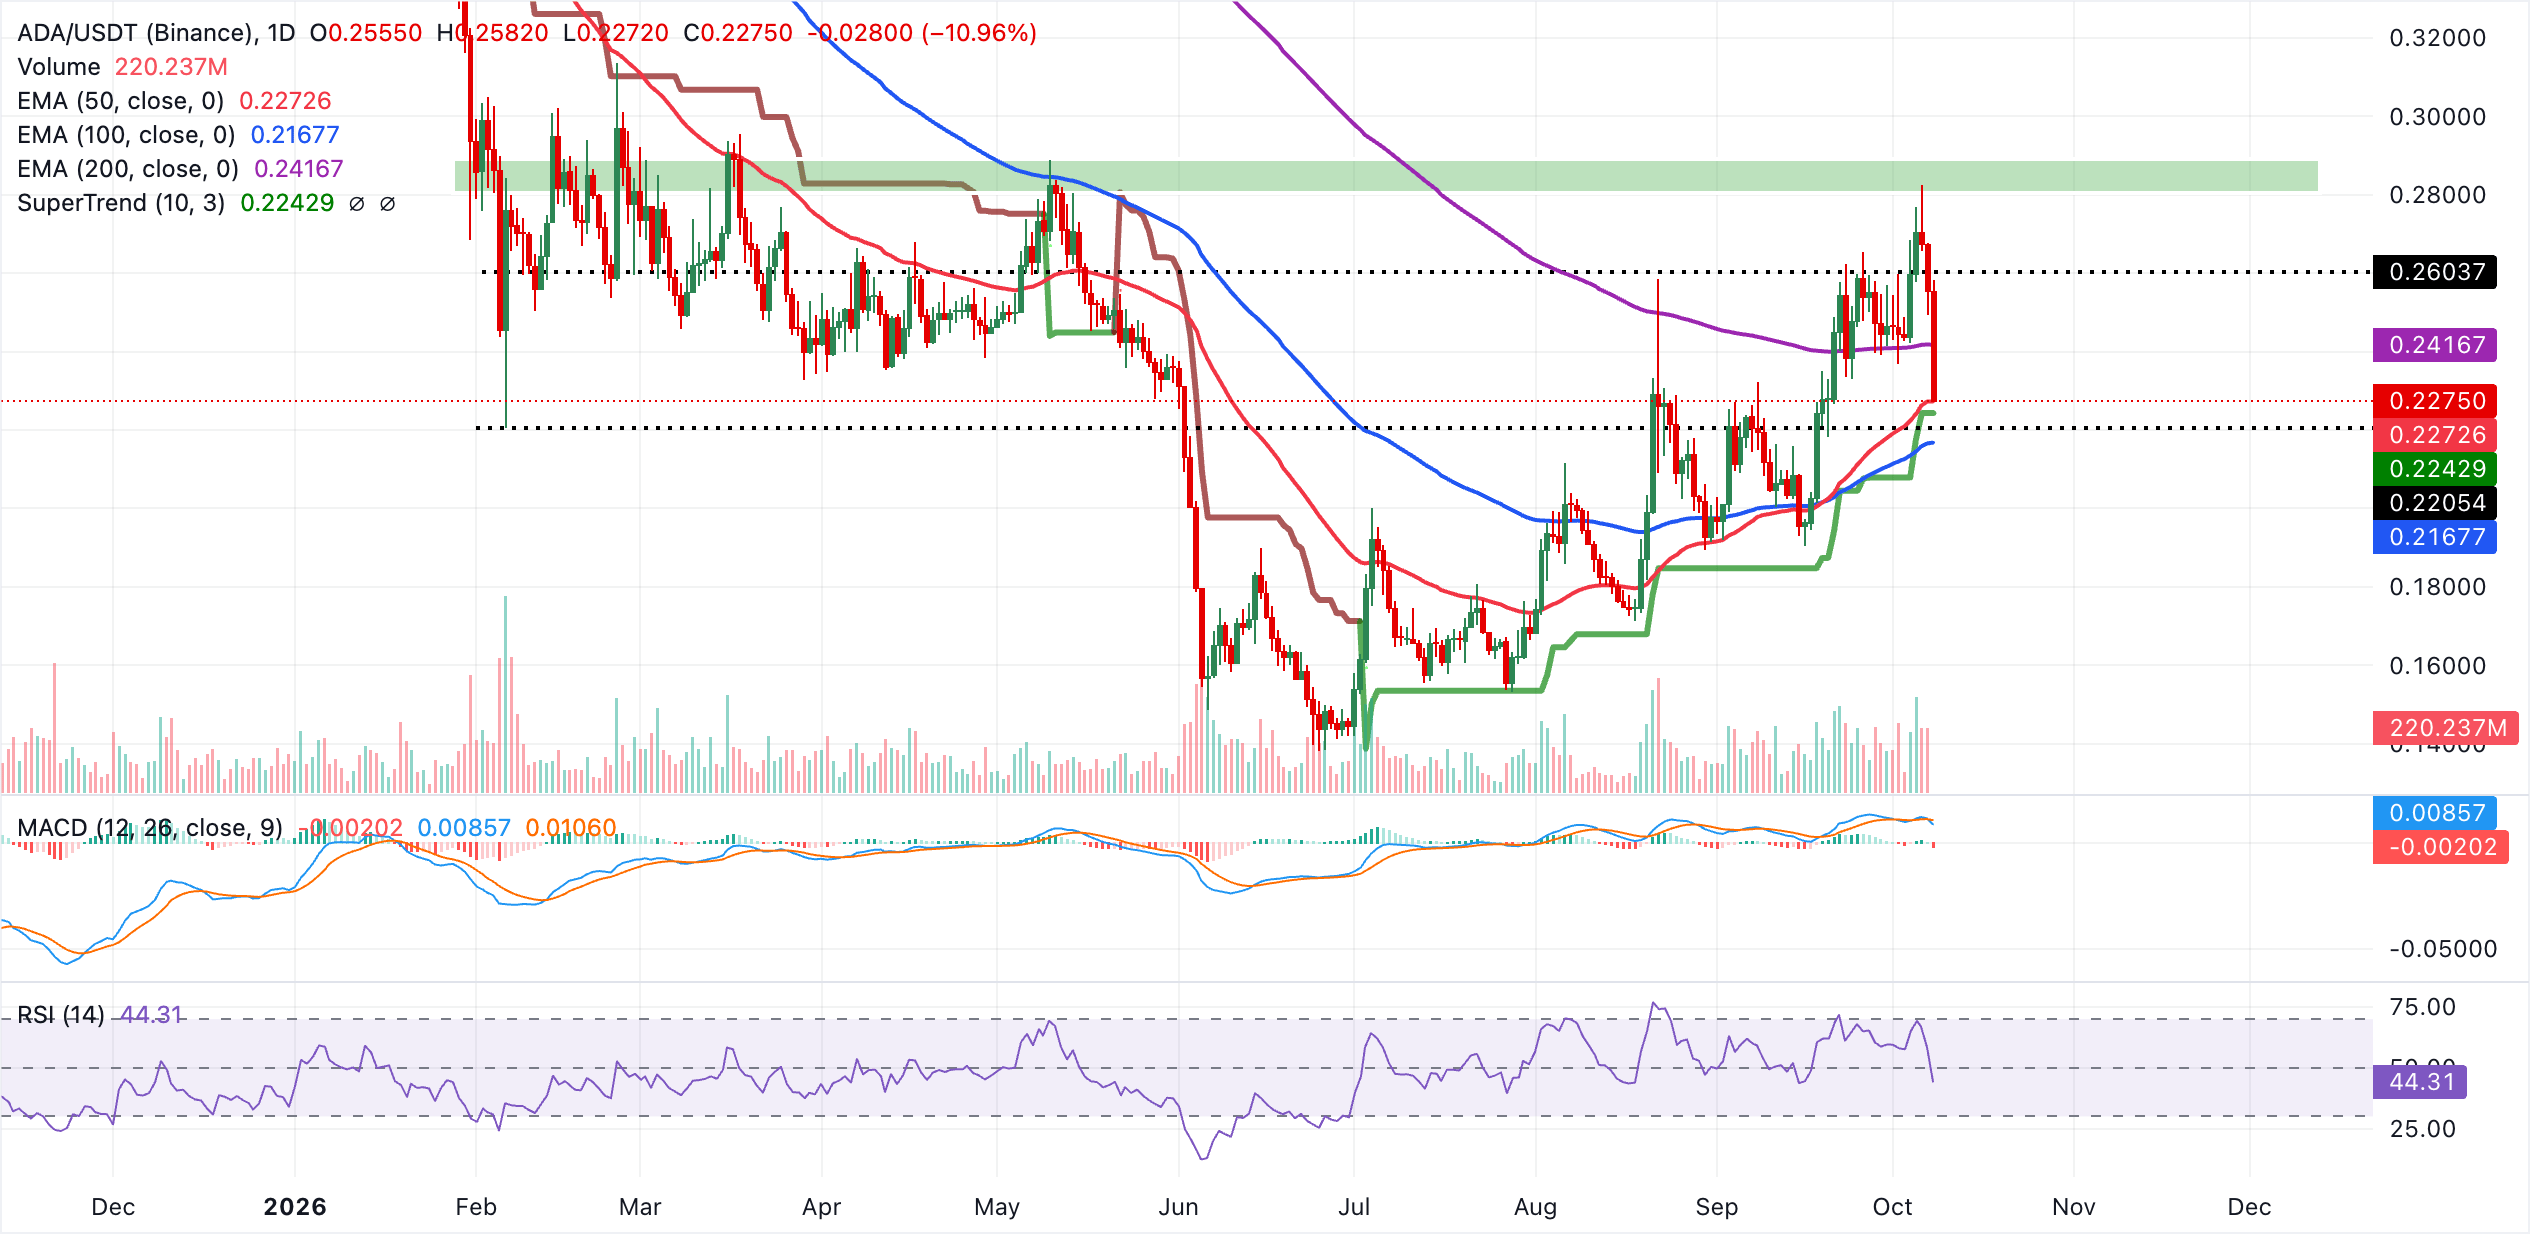
Immediate support lies at the 50-day EMA near $0.2272 and the SuperTrend zone at $0.2243, before deeper demand emerges around the 100-day EMA at $0.2168. As long as ADA holds above this stacked support cluster, the near-term bias stays tilted to the upside, with any pullback likely to be treated as a corrective dip.
Despite the above EMA support cluster, Cardano maintains bearish near-term bias on the weekly chart. The 50-week EMA at $0.3062, the 100-week EMA at $0.4073 and the 200-week EMA at $0.4585 all sit overhead, suggesting the broader trend remains under downside pressure despite a modest improvement in momentum.
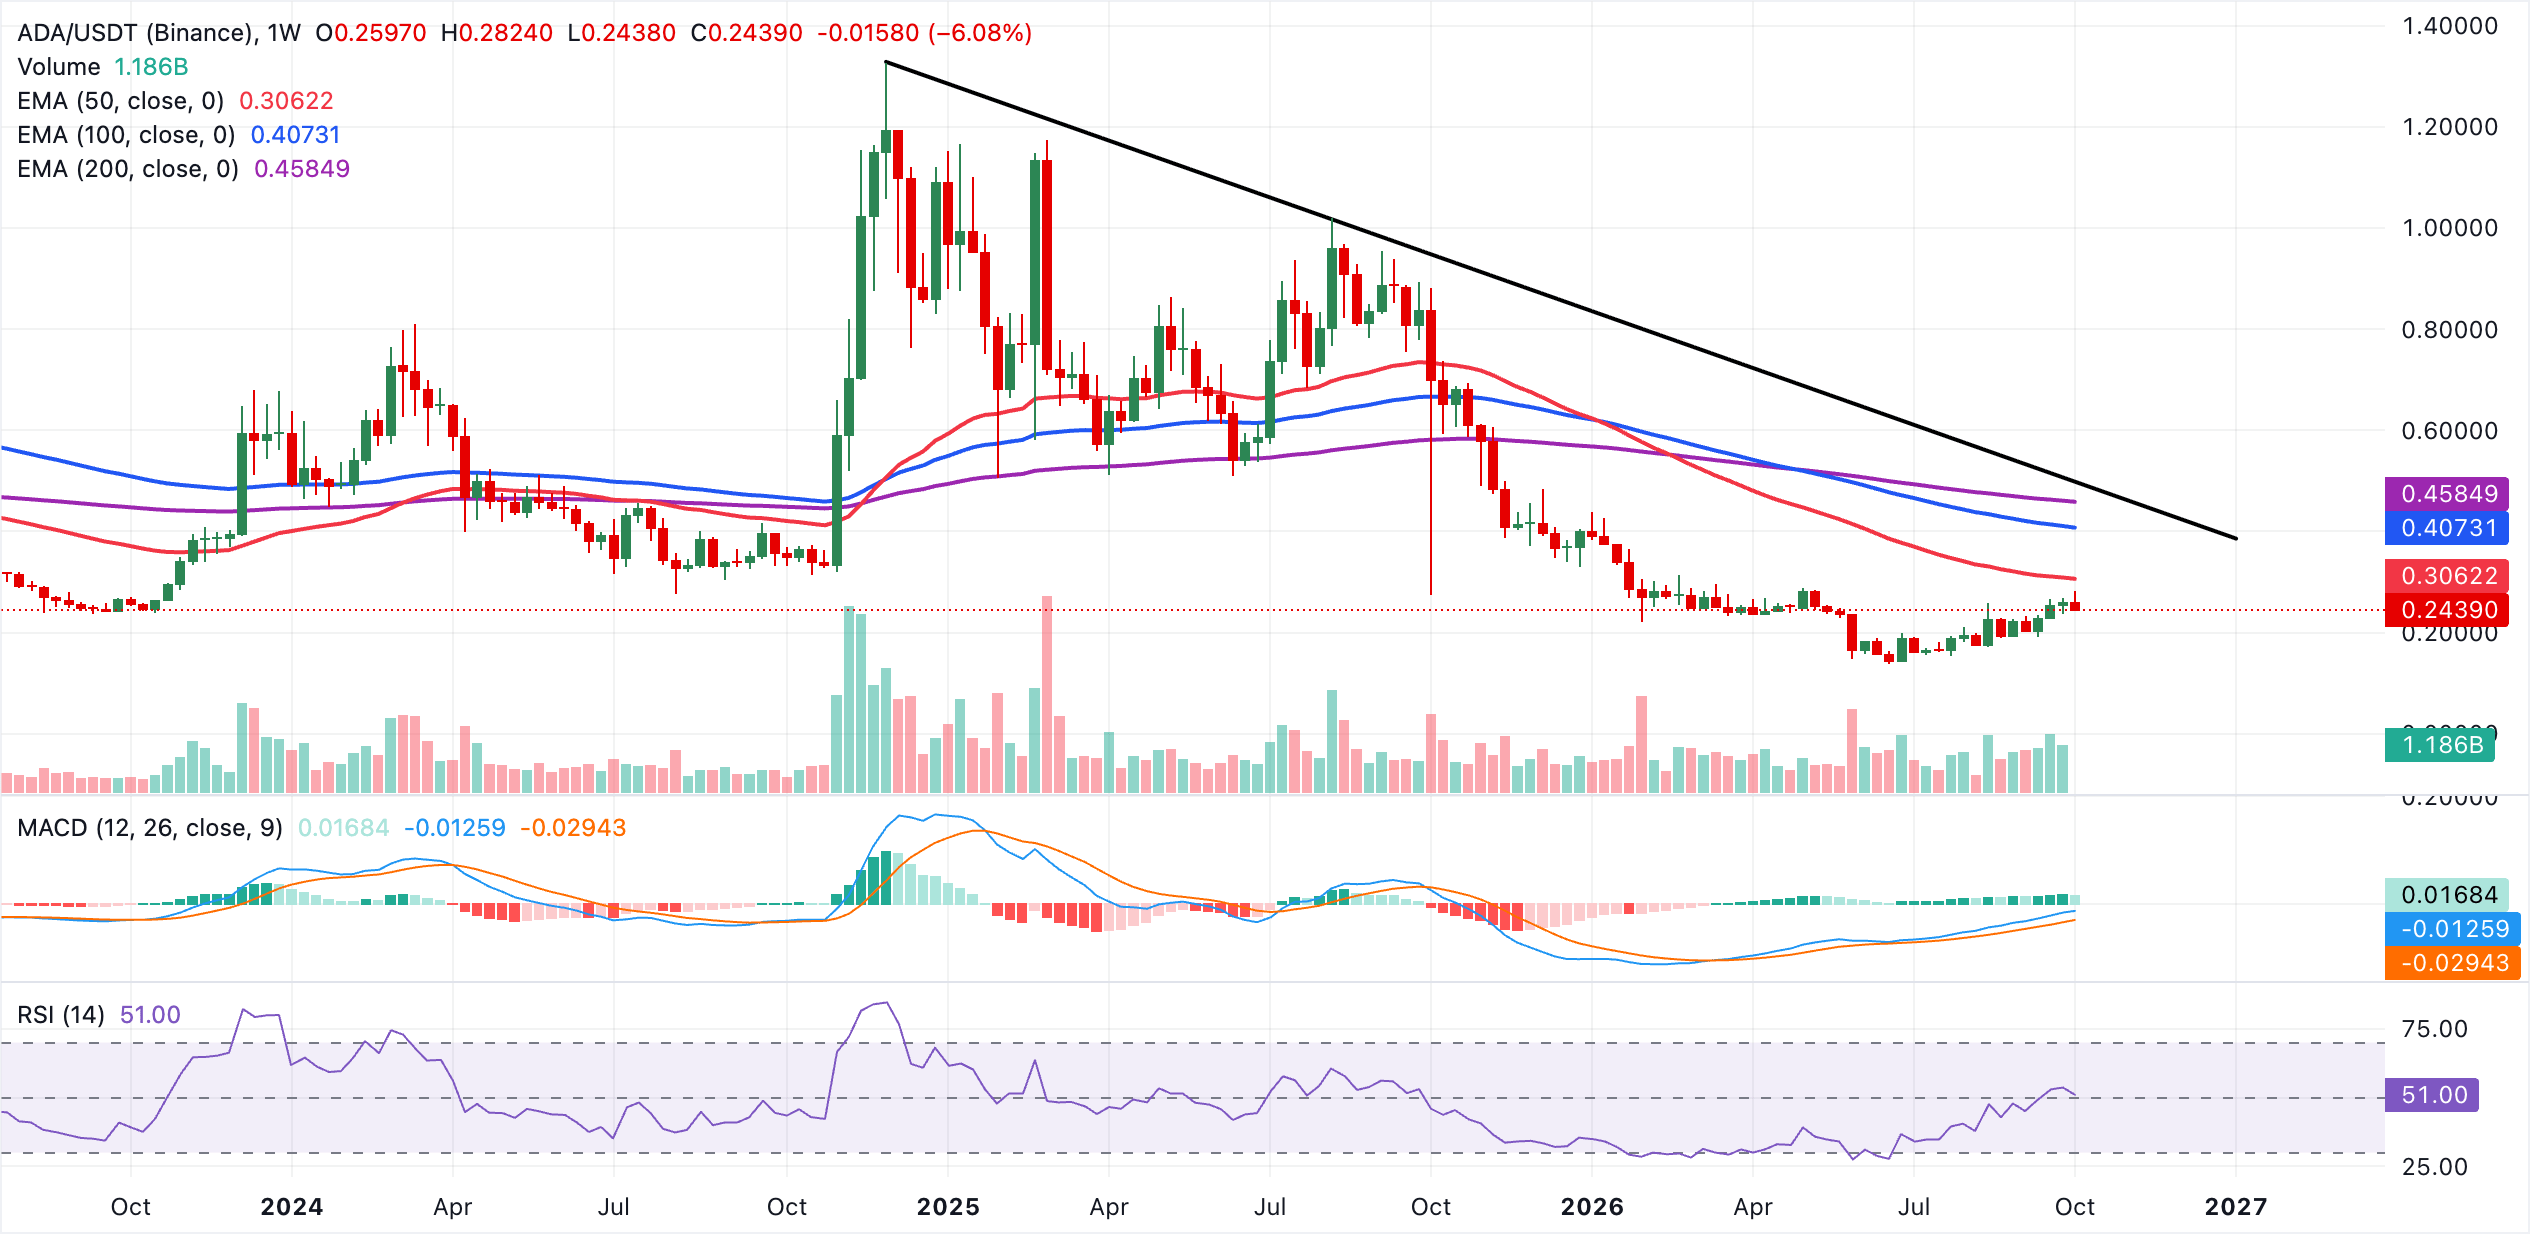
The MACD stays positive and above its signal line, while the histogram has eased slightly from recent highs, hinting at fading bullish momentum rather than a decisive trend shift. Meanwhile, the RSI trades just above 50, pointing to neutral conditions and reinforcing the idea of a capped recovery within a dominant bearish structure.
(The technical analysis of this story was written with the help of an AI tool. Know more.)
Open Interest, funding rate FAQs
Higher Open Interest is associated with higher liquidity and new capital inflow to the market. This is considered the equivalent of increase in efficiency and the ongoing trend continues. When Open Interest decreases, it is considered a sign of liquidation in the market, investors are leaving and the overall demand for an asset is on a decline, fueling a bearish sentiment among investors.
Funding fees bridge the difference between spot prices and prices of futures contracts of an asset by increasing liquidation risks faced by traders. A consistently high and positive funding rate implies there is a bullish sentiment among market participants and there is an expectation of a price hike. A consistently negative funding rate for an asset implies a bearish sentiment, indicating that traders expect the cryptocurrency’s price to fall and a bearish trend reversal is likely to occur.
Top Articles
1Forex Today: US flash Consumer Sentiment and Canadian jobs in the limelight2Malaysian Ringgit: Fiscal anchor case – MUFG3Fed's Musalem signals more tightening as inflation stays elevated4Japanese Yen finds relief as Trump rules out Iran strikes before midterms5Singapore Dollar: Further weakness possible against US Dollar – UOB6Cardano Price Forecast: ADA tumbles below $0.25 as retail participation dips7US President Trump rules out Iran strike before midterms, talks resume8Dollar Index flatlines as Fed Governor Waller puts no date on more hikes9Crude Oil grinds higher on record tanker attacks and Houthi missiles
LIVE QUOTES


ALL ABOUT TECHNICAL
What Is ICT Trading? Inner Circle Trader Concepts Explained
Support and Resistance: Meaning, Types, How to Draw Levels & Trading Strategies
What Is Liquidity? Meaning in Trading and Financial Markets
Liquidity Sweep: Meaning, Examples & Trading Strategy
Market Structure in Trading: The Complete Guide (Bullish, Bearish, Sideways)
Change of Character (CHoCH): Definition, Examples & Strategy
What Is the Bullish Kicker Pattern and How to Trade It?
What Is a Dragonfly Doji Candlestick and How Do You Trade It?
What Is an Inverted Hammer Candlestick Pattern and How Do You Trade It?
Get Started!
Sign up and access the Global Markets in less than 3 minutes

Connect With Us









Contacts
Phone: +61 2 8036 8388
Fax: +61 2 8036 8388
Email: support@tmgm.com



The information provided on this website is of a general nature only and does not constitute personal financial advice. Before acting on any information on this website, you should consider the suitability of the information in relation to your objectives, financial situation and needs. Investing in CFDs and FX Margin Contracts carries significant risks and is not suitable for all investors. You may lose more than your initial deposit. You do not own, or have, any interest in the underlying asset. We recommend that you seek independent advice and ensure you fully understand the risks involved before trading. It is important that you read and consider the disclosure document before you acquire any product listed on the website. The information and advertisements offered on this website are not intended for use by any person in any country or jurisdiction where such use would be contrary to local laws and regulations. The Products and Services offered on this website are not intended for residents of the United States, Malaysia and Thailand.
TMGM is authorized and regulated in various jurisdictions.
Trademax Australia Limited, trading as TMGM, is regulated by the Australian Securities and Investments Commission (ASIC), AFSL no. 436416 and is located at Level 28, One International Tower, 100 Barangaroo Avenue, 2000 Sydney, NSW Australia.
Email: support@tmgm.com.au
Trademax Global Limited, trading as TMGM, is authorized and regulated by the Vanuatu Financial Services Commission (VFSC), registration number 40356 and registered at 1276, Kumul Highway, Port Vila, Vanuatu, Republic of Vanuatu.
Email: support@tmgm.com
Trademax Global Markets (SE) Limited, trading as TMGM, is authorized and regulated by the Financial Services Authority (FSA) of Seychelles, with license number SD224. The company is registered at Office No 13, Providence Estate ABIS Centre, Mahe, Seychelles.
Email: support@tmgm.com
Trademax Global Markets (International) Pty Ltd, trading as TMGM, is authorized and regulated by the Financial Services Commission, Mauritius (FSC) with license no. GB22201012, and registered at 33, Edith Cavell Street C/o IQ EQ Fund Services (Mauritius) Ltd Port Louis, 11324 Mauritius.
Email: support@tmgm.com
Copyright © TMGM. All rights reserved