

Trading
Explore a wide range of markets with competitive pricing, deep liquidity, and advanced trading tools.
Learn More 
Platform
Trade seamlessly with TMGM's powerful platform, built for speed, precision, and a superior trading experience.
Learn More Trading Platform
Academy
Learn the fundamentals of trading with beginner-friendly resources, including guides, webinars, and market insights.
Learn More News & Analysis
Get real-time market updates and expert analysis to stay ahead of trading opportunities
Learn More News & Analysis
About
Learn what sets TMGM apart — our global presence, regulatory strength, and commitment to innovation in trading.
Learn More Why Choose TMGM
Sponsorship
AUD/USD Price Forecast: Can antipodean currencies withstand pressure from rising oil prices?
- AUD/USD slides towards 0.7000, with rising oil prices putting the Australian Dollar under pressure.
- Risks of renewed escalation in Middle East tensions have emerged following the withdrawal of US non-emergency personnel from the Gulf.
- October’s preliminary PMI releases for Australia and the US remain a key focus for investors.
Selling pressure leaves the Australian Dollar trailing all its major currency counterparts apart from the New Zealand Dollar (NZD) on Thursday. The Australian currency has lost 0.4% against the US Dollar (USD), taking it close to the psychological 0.7000 mark.

How Is The Australian Dollar Performing Today?
Today’s percentage movements in the Australian Dollar (AUD) against the major currencies listed are set out below. Its weakest performance was against the Japanese Yen.
| USD | EUR | GBP | JPY | CAD | AUD | NZD | CHF | |
|---|---|---|---|---|---|---|---|---|
| USD | 0.30% | 0.23% | -0.85% | -0.03% | 0.48% | 0.55% | -0.32% | |
| EUR | -0.30% | -0.08% | -1.14% | -0.34% | 0.17% | 0.24% | -0.65% | |
| GBP | -0.23% | 0.08% | -1.07% | -0.30% | 0.24% | 0.31% | -0.56% | |
| JPY | 0.85% | 1.14% | 1.07% | 0.80% | 1.33% | 1.37% | 0.51% | |
| CAD | 0.03% | 0.34% | 0.30% | -0.80% | 0.52% | 0.60% | -0.29% | |
| AUD | -0.48% | -0.17% | -0.24% | -1.33% | -0.52% | 0.06% | -0.80% | |
| NZD | -0.55% | -0.24% | -0.31% | -1.37% | -0.60% | -0.06% | -0.84% | |
| CHF | 0.32% | 0.65% | 0.56% | -0.51% | 0.29% | 0.80% | 0.84% |
Percentage movements between major currencies are illustrated in the heat map. Read the base currency from the left-hand column and the quote currency from the top row. For instance, selecting the Australian Dollar on the left and following that row across to the US Dollar gives the percentage change for AUD (base)/USD (quote).
Currencies regarded as risk-sensitive are facing selling pressure as concerns over renewed escalation in Middle East tensions drive oil prices sharply higher. WTI Oil is trading near $99.00 at the time of writing, a gain of 1.5%.
According to Commerzbank analysts, Middle East tensions “intensified after a drone attack on Saudi Arabia's Shaybah oil field killed two people and injured two others,” although the eventual effect on crude prices remained limited. The analysts point out that “oil prices briefly jumped on reports suggesting a wider withdrawal of US diplomatic personnel from the Gulf,” but those gains subsequently faded. The market trimmed its earlier advance as “Washington clarified that the order was limited to Saudi Arabia,” they note.
Adding to the pressure on AUD/USD is a rebound in the US Dollar Index (DXY). During European trading, the index has recovered towards 101.66 after retesting a three-week low near 101.45. DXY measures the Greenback’s value against six major currencies.
Friday’s flash private-sector PMI releases for October from Australia and the United States (US) are expected to provide the next catalyst for the Australian Dollar and the US Dollar.
AUD/USD Technical Analysis: Can Buyers Regain Control?
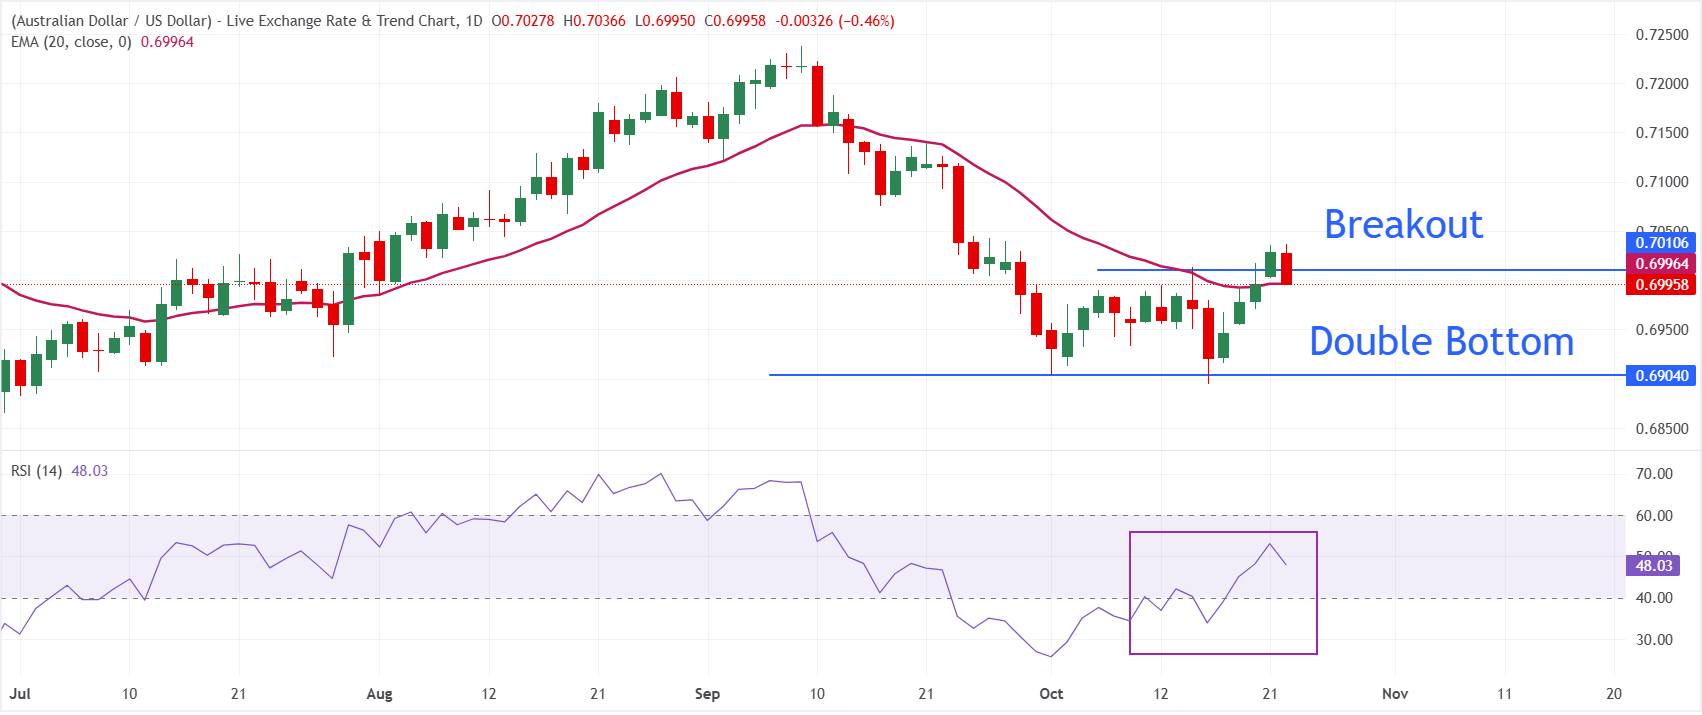
On the daily chart, the 0.6996 trading level places AUD/USD precisely at its 20-day exponential moving average (EMA), also near 0.6996. That makes the average a key pivot, with the short-term outlook remaining neutral as the pair fluctuates around this dynamic line.
Directional momentum remains unclear, with the Relative Strength Index (RSI) at 48, just short of the 50 threshold. Although the recent downward pressure has eased, buyers have not yet established firm control.
Following a breakout from the Double Bottom formation, the pair remains anchored to the 20-day EMA. A sustained close above this pivot would give bulls scope to reassert control and seek a recovery towards earlier highs around 0.7036. Conversely, a break below the 15 October low of 0.6894 could set off another leg lower in AUD/USD.
(The technical analysis of this story was written with the help of an AI tool. Know more.)
US Dollar: Common Questions Answered
As the official currency of the United States of America, the US Dollar (USD) also circulates alongside local banknotes as the ‘de facto’ currency in a significant number of other countries. No other currency is traded more heavily worldwide. Data from 2022 show that it accounts for over 88% of global foreign exchange turnover, equivalent to average daily transactions of $6.6 trillion. The USD replaced the British Pound as the world’s reserve currency after the Second World War. Gold backed the US Dollar for most of its history, until the Gold Standard ended with the Bretton Woods Agreement in 1971.
Monetary policy set by the Federal Reserve (Fed) is the single biggest influence on the US Dollar’s value. Adjusting interest rates is the Fed’s main means of meeting its two mandates: maintaining price stability by controlling inflation and promoting full employment. The Fed raises rates when prices increase too rapidly and inflation exceeds its 2% target, supporting the USD. By contrast, inflation below 2% or an excessively high Unemployment Rate may prompt the Fed to cut interest rates, putting pressure on the Greenback.
A weaker US Dollar is usually the outcome of quantitative easing (QE), an exceptional measure under which the Federal Reserve prints additional Dollars. Through QE, the Fed sharply expands the supply of credit within a stalled financial system. This unconventional policy is deployed when banks stop lending to one another for fear of counterparty default, causing credit to dry up. It serves as a last resort if interest-rate cuts alone are unlikely to deliver the required outcome. During the Great Financial Crisis in 2008, QE was the Fed’s preferred tool for tackling the credit crunch. The process entails printing more Dollars and using them to purchase US government bonds, mainly from financial institutions.
Usually supportive of the US Dollar, quantitative tightening (QT) reverses this process. The Federal Reserve ceases bond purchases from financial institutions and, as bonds in its portfolio mature, does not reinvest the principal in further purchases.
POPULAR ARTICLES
1AUD/USD Price Forecast: Can antipodean currencies withstand pressure from rising oil prices?2New Zealand Dollar: Limited support against USD from RBNZ rate hikes - BBH3Euro: What defines its monetary reach and limits? – Commerzbank4Why is the New Zealand Dollar lagging as NZ inflation eases?5Gold falls below $4,100: How is the Middle East energy shock reinforcing the hawkish Fed outlook?6Crypto Today: Why are Bitcoin, Ethereum and XRP falling despite net ETF inflows?7Gold Price Forecast: Can XAU/USD hold key support at $4,070 as high oil prices test the level?8British Pound: Why Does Sterling’s High-Carry Profile Support It Against the Euro? – ING9Indian Rupee: How are trade hopes lifting INR against the US Dollar? - Societe Generale
LIVE QUOTES

ALL ABOUT FOREX
What Is a Stop Loss, How Does It Work and How Do You Set One?
Margin Call Meaning: What It Is, What Triggers It, and How to Avoid One
What Is an Islamic Account in Forex?
Best Indicators for Forex Trading and How to Use Them
The Top 10 Most Traded Currency Pairs in the World
What are the Major Forex Pairs? 7 Major Currency Pairs in the World
5 Best Forex Trading Apps In India In 2026
Top 15 Weakest Currencies in the World
Best Time to Trade Forex
Get Started!
Sign up and access the Global Markets in less than 3 minutes

Connect With Us









Contacts
Phone: +61 2 8036 8388
Fax: +61 2 8036 8388
Email: support@tmgm.com



The information provided on this website is of a general nature only and does not constitute personal financial advice. Before acting on any information on this website, you should consider the suitability of the information in relation to your objectives, financial situation and needs. Investing in CFDs and FX Margin Contracts carries significant risks and is not suitable for all investors. You may lose more than your initial deposit. You do not own, or have, any interest in the underlying asset. We recommend that you seek independent advice and ensure you fully understand the risks involved before trading. It is important that you read and consider the disclosure document before you acquire any product listed on the website. The information and advertisements offered on this website are not intended for use by any person in any country or jurisdiction where such use would be contrary to local laws and regulations. The Products and Services offered on this website are not intended for residents of the United States, Malaysia and Thailand.
TMGM is authorized and regulated in various jurisdictions.
Trademax Australia Limited, trading as TMGM, is regulated by the Australian Securities and Investments Commission (ASIC), AFSL no. 436416 and is located at Level 28, One International Tower, 100 Barangaroo Avenue, 2000 Sydney, NSW Australia.
Email: support@tmgm.com.au
Trademax Global Limited, trading as TMGM, is authorized and regulated by the Vanuatu Financial Services Commission (VFSC), registration number 40356 and registered at 1276, Kumul Highway, Port Vila, Vanuatu, Republic of Vanuatu.
Email: support@tmgm.com
Trademax Global Markets (SE) Limited, trading as TMGM, is authorized and regulated by the Financial Services Authority (FSA) of Seychelles, with license number SD224. The company is registered at Office No 13, Providence Estate ABIS Centre, Mahe, Seychelles.
Email: support@tmgm.com
Trademax Global Markets (International) Pty Ltd, trading as TMGM, is authorized and regulated by the Financial Services Commission, Mauritius (FSC) with license no. GB22201012, and registered at 33, Edith Cavell Street C/o IQ EQ Fund Services (Mauritius) Ltd Port Louis, 11324 Mauritius.
Email: support@tmgm.com
Copyright © TMGM. All rights reserved