

Trading
Explore a wide range of markets with competitive pricing, deep liquidity, and advanced trading tools.
Learn More 
Platform
Trade seamlessly with TMGM's powerful platform, built for speed, precision, and a superior trading experience.
Learn More Trading Platform
Academy
Learn the fundamentals of trading with beginner-friendly resources, including guides, webinars, and market insights.
Learn More News & Analysis
Get real-time market updates and expert analysis to stay ahead of trading opportunities
Learn More News & Analysis
About
Learn what sets TMGM apart — our global presence, regulatory strength, and commitment to innovation in trading.
Learn More Why Choose TMGM
Sponsorship
Can Gold overcome pressure below $4,100 as US Nonfarm Payrolls moves into focus?
- Gold comes under pressure from a recovering US Dollar before the US jobs report.
- Bullion could extend its decline if a stronger US jobs report boosts the Dollar.
- Liquidity pressures from the AI-led equity rout leave Gold vulnerable to selling.
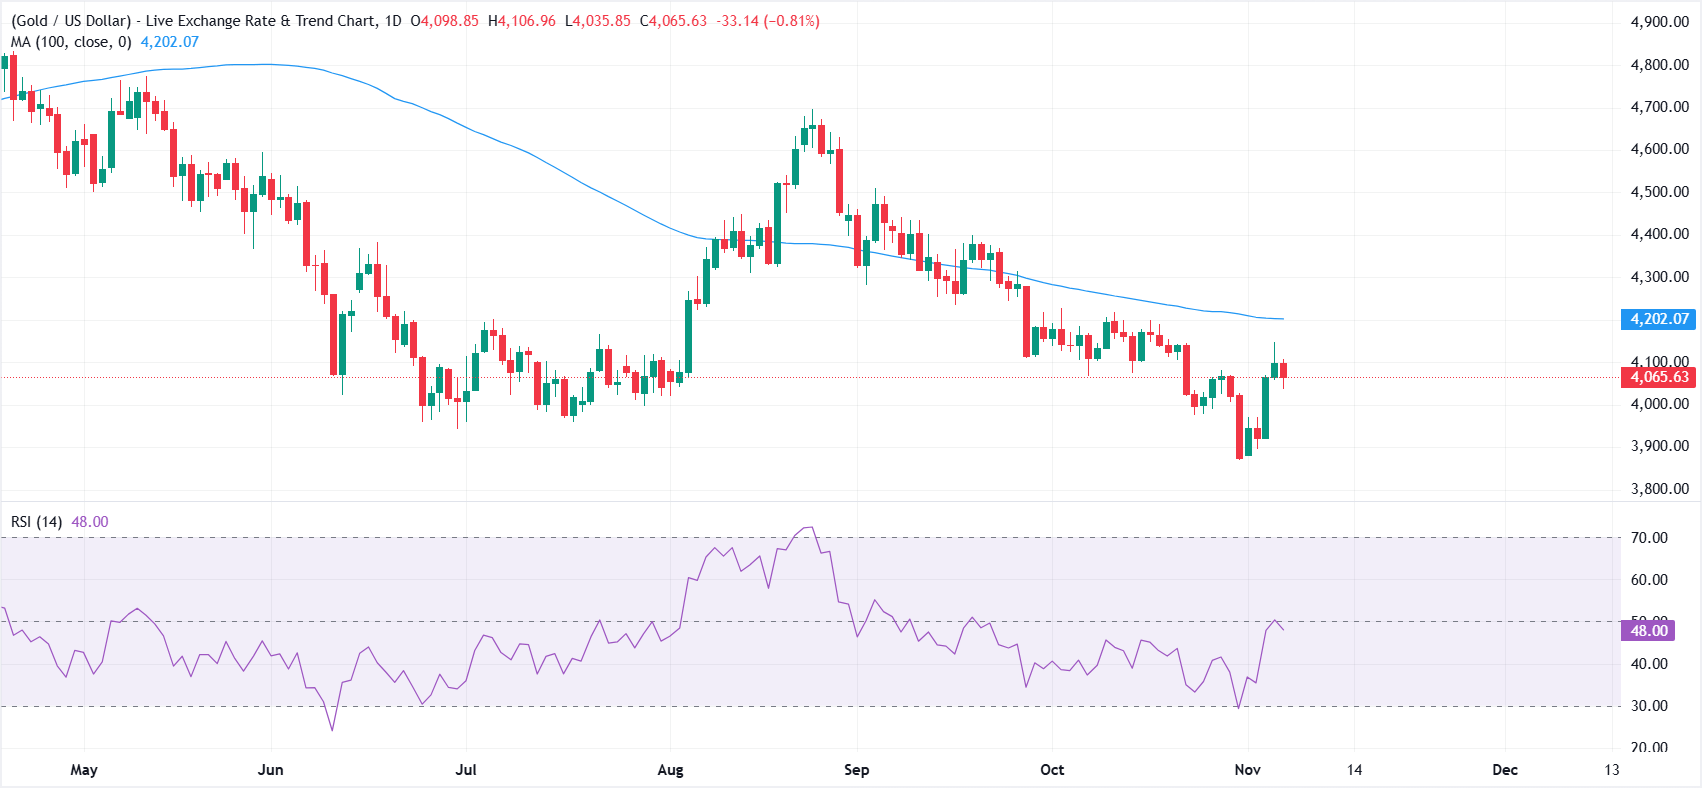
A recovering US Dollar (USD) is weighing on Gold (XAU/USD) on Friday as markets await the US Nonfarm Payrolls report at 13:30 GMT. The metal remains under pressure below $4,100, having touched a two-week high of $4,146 a day earlier. At the time of writing, XAU/USD is trading near $4,065, a decline of 0.81% for the day, after hitting an intraday low of $4,035.

Forecasts put October job additions in the US economy at 65K, compared with 29K in September, with the Unemployment Rate expected to remain unchanged at 4.2%. A reading above expectations would signal resilience in the labour market and allow the Federal Reserve (Fed) greater scope to continue its fight against inflation.
Expectations of a December interest rate hike could consequently strengthen, supporting the US Dollar and adding to Gold’s downside pressure. Weaker figures, by contrast, could scale back those expectations, hurting the Greenback and aiding a recovery in bullion.
At around 102.00, the US Dollar Index (DXY) is 0.40% higher on the day. The index measures the Greenback’s performance against a basket of six major currencies.
At the same time, Gold faces the risk of liquidity-driven selling as the AI-led equity decline intensifies. Investors are trimming positions to generate cash, meet margin calls or offset losses in other assets.
Despite this pressure, a steep fall in Oil prices is helping bullion remain on course to end a three-week run of losses. West Texas Intermediate (WTI) has fallen around 12% so far this week. The Democratic sweep of Congress in the US midterm elections has raised expectations that lawmakers could rein in President Donald Trump’s military campaign against Iran.
Gold’s gains are nevertheless being constrained by a partial rebound in Oil prices, while a negotiated resolution to the US-Iran war continues to look distant despite diplomatic efforts. According to US President Donald Trump, the US may have to “destroy” the rest of Iran. He added that people will “know soon enough” whether he will act.
Since the war started in late February, bullion has been driven in large part by Crude prices and their implications for inflation and interest rates. Rising energy costs have increased the pressure on central banks to tighten monetary policy, leaving the non-yielding metal under strain.
How Is the US Dollar Performing Today?
The US Dollar recorded its strongest performance against the New Zealand Dollar today. The table below sets out the percentage changes in the US Dollar (USD) against the major currencies listed.
| USD | EUR | GBP | JPY | CAD | AUD | NZD | CHF | |
|---|---|---|---|---|---|---|---|---|
| USD | 0.39% | 0.41% | 0.28% | 0.38% | 0.85% | 0.93% | 0.11% | |
| EUR | -0.39% | 0.02% | -0.09% | -0.00% | 0.46% | 0.53% | -0.29% | |
| GBP | -0.41% | -0.02% | -0.11% | -0.02% | 0.45% | 0.51% | -0.31% | |
| JPY | -0.28% | 0.09% | 0.11% | 0.11% | 0.57% | 0.64% | -0.18% | |
| CAD | -0.38% | 0.00% | 0.02% | -0.11% | 0.46% | 0.53% | -0.28% | |
| AUD | -0.85% | -0.46% | -0.45% | -0.57% | -0.46% | 0.07% | -0.74% | |
| NZD | -0.93% | -0.53% | -0.51% | -0.64% | -0.53% | -0.07% | -0.80% | |
| CHF | -0.11% | 0.29% | 0.31% | 0.18% | 0.28% | 0.74% | 0.80% |
Percentage movements between the major currencies are displayed in the heat map. Select the base currency in the left-hand column and the quote currency in the top row. For instance, choosing the US Dollar on the left and following that row across to the Japanese Yen gives the percentage change for USD (base)/JPY (quote) in the corresponding cell.
POPULAR ARTICLES
1Euro: Why is the shift into Dollar cash capping gains against US Dollar? – ING2Can Gold overcome pressure below $4,100 as US Nonfarm Payrolls moves into focus?3Why is the Euro slipping as weak Eurozone data and BoJ tightening bets support the Japanese Yen?4Pi Network Price Forecast: How is the market sell-off after US midterm elections weighing on PI?5Crypto Today: Reversal of post-midterm elections rally deepens losses in Bitcoin, Ethereum and XRP6How does a Democratic Congress affect Bitcoin and crypto
regulation?7Democrats win House and Senate in US midterms: Why might crypto still find positives?8Eurozone Retail Sales (YoY) below expectations (0.6%) in September: Actual (0.4%)9Eurozone Retail Sales (MoM) registered at -0.7%, below expectations (-0.1%) in September


Get Started!
Sign up and access the Global Markets in less than 3 minutes

Connect With Us









Contacts
Phone: +61 2 8036 8388
Fax: +61 2 8036 8388
Email: support@tmgm.com



The information provided on this website is of a general nature only and does not constitute personal financial advice. Before acting on any information on this website, you should consider the suitability of the information in relation to your objectives, financial situation and needs. Investing in CFDs and FX Margin Contracts carries significant risks and is not suitable for all investors. You may lose more than your initial deposit. You do not own, or have, any interest in the underlying asset. We recommend that you seek independent advice and ensure you fully understand the risks involved before trading. It is important that you read and consider the disclosure document before you acquire any product listed on the website. The information and advertisements offered on this website are not intended for use by any person in any country or jurisdiction where such use would be contrary to local laws and regulations. The Products and Services offered on this website are not intended for residents of the United States, Malaysia and Thailand.
TMGM is authorized and regulated in various jurisdictions.
Trademax Australia Limited, trading as TMGM, is regulated by the Australian Securities and Investments Commission (ASIC), AFSL no. 436416 and is located at Level 28, One International Tower, 100 Barangaroo Avenue, 2000 Sydney, NSW Australia.
Email: support@tmgm.com.au
Trademax Global Limited, trading as TMGM, is authorized and regulated by the Vanuatu Financial Services Commission (VFSC), registration number 40356 and registered at 1276, Kumul Highway, Port Vila, Vanuatu, Republic of Vanuatu.
Email: support@tmgm.com
Trademax Global Markets (SE) Limited, trading as TMGM, is authorized and regulated by the Financial Services Authority (FSA) of Seychelles, with license number SD224. The company is registered at Office No 13, Providence Estate ABIS Centre, Mahe, Seychelles.
Email: support@tmgm.com
Trademax Global Markets (International) Pty Ltd, trading as TMGM, is authorized and regulated by the Financial Services Commission, Mauritius (FSC) with license no. GB22201012, and registered at 33, Edith Cavell Street C/o IQ EQ Fund Services (Mauritius) Ltd Port Louis, 11324 Mauritius.
Email: support@tmgm.com
Copyright © TMGM. All rights reserved