

Trading
Explore a wide range of markets with competitive pricing, deep liquidity, and advanced trading tools.
Learn More 
Platform
Trade seamlessly with TMGM's powerful platform, built for speed, precision, and a superior trading experience.
Learn More Trading Platform
Academy
Learn the fundamentals of trading with beginner-friendly resources, including guides, webinars, and market insights.
Learn More News & Analysis
Get real-time market updates and expert analysis to stay ahead of trading opportunities
Learn More News & Analysis
About
Learn what sets TMGM apart — our global presence, regulatory strength, and commitment to innovation in trading.
Learn More Why Choose TMGM
Sponsorship
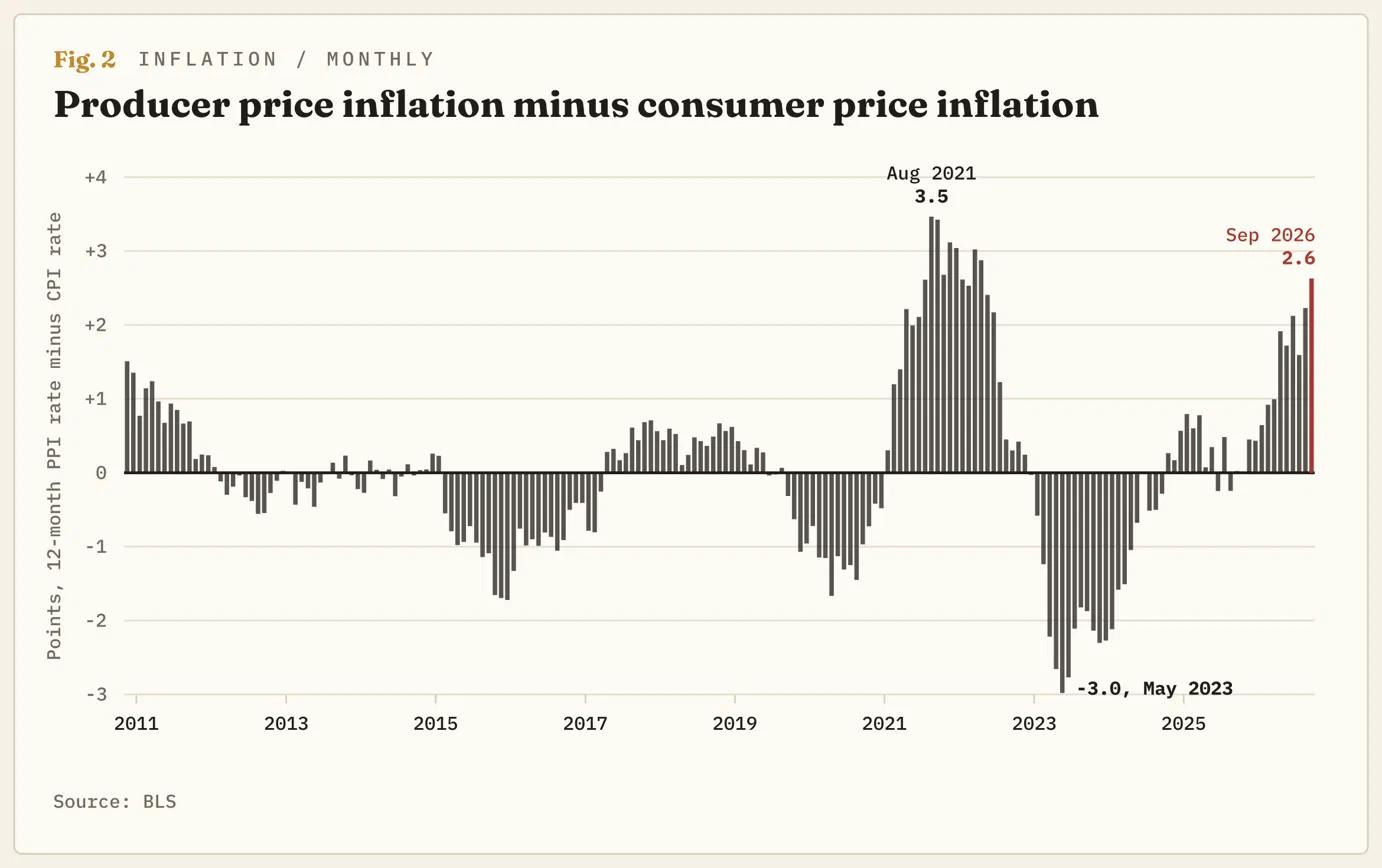
Who bears the gap between producer and consumer prices? This chart shows, as producer prices rise 6.3% while consumer prices increase by only 3.7%.
A widening inflation gap is dividing corporate winners from losers: the Producer Price Index climbed 6.3% in the year to September, against a 3.7% increase in the Consumer Price Index, leaving the largest spread since 2022. Within the S&P 500, energy and technology businesses capture that difference while other companies absorb it. Shoppers face their turn in 2027.
Businesses and households faced markedly different inflation pressures in September, when the two monthly inflation readings published by the Bureau of Labor Statistics (BLS) diverged. Prices received by US businesses for their sales, measured by the Producer Price Index (PPI), increased 6.3% over the year, the fastest rise since December 2022. Household purchase prices, tracked by the Consumer Price Index (CPI), increased 3.7%. Across the 16 years for which the PPI has been available in its current form, that 2.6-point spread ranks eighth widest. Every one of the seven larger gaps occurred between August 2021 and April 2022.

Trading roughly 2% below its October 6 record, the S&P 500 is also delivering near-record profitability. FactSet's calculation, combining reported results with estimates, puts this quarter's profit at 14.9 cents for every dollar of company sales, the second-highest margin in its records dating to 2009. These outcomes coexist because some index constituents receive the 6.3% increase while others pay it. This week's corporate results have begun to reveal which businesses fall into each camp.
Are Two Sectors Driving the Average?
Different index weightings explain some of the divergence. Housing accounts for a third of the CPI but is absent from the PPI, while energy producer prices jumped 10.8% in September alone. Beyond that arithmetic, money is being transferred from buyers of fuel, resin and freight to their suppliers. Both sides of those transactions sit within the S&P 500.
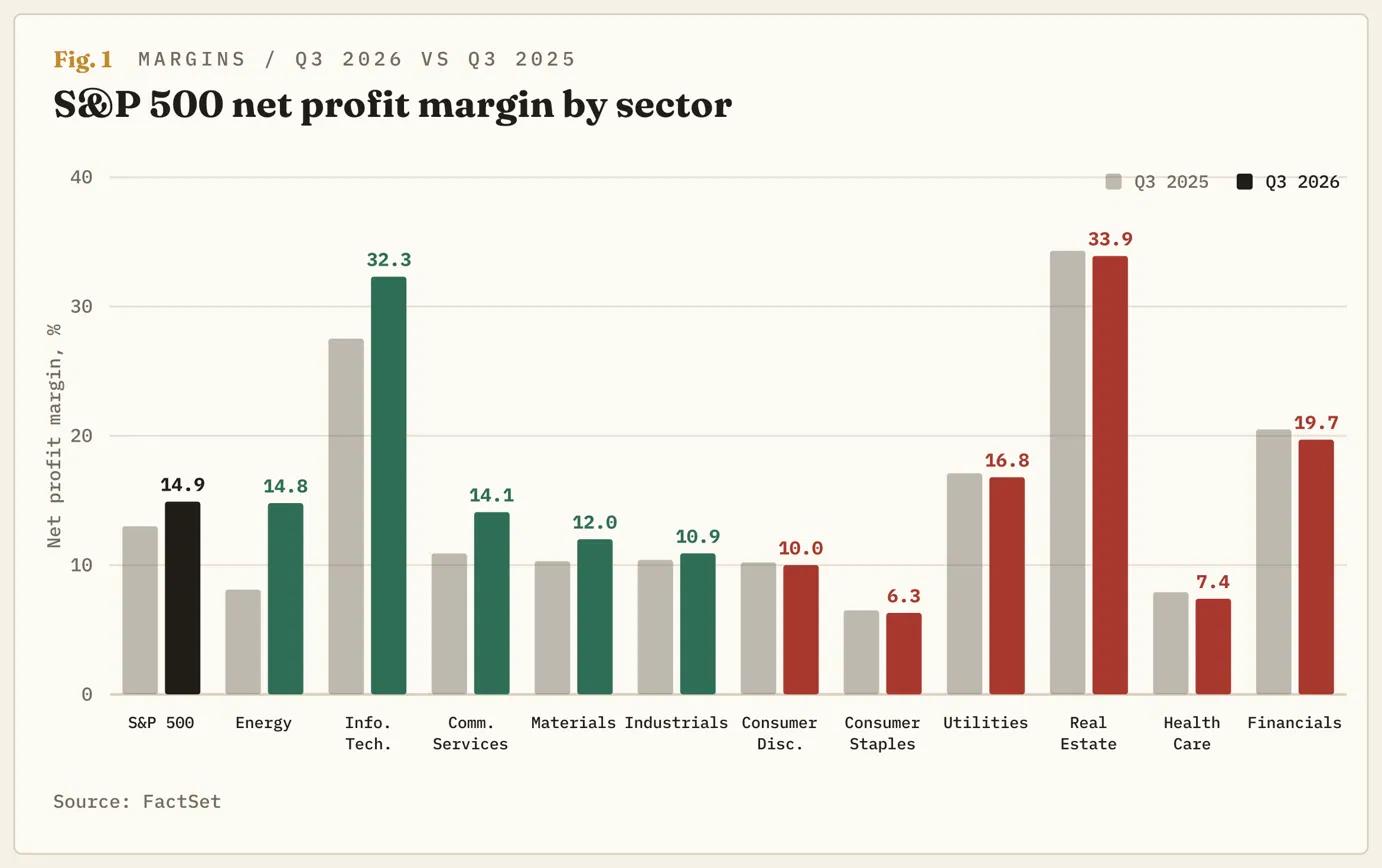
With quarterly oil prices averaging $85.68 per barrel rather than $64.97 a year earlier, FactSet puts the energy sector's margin at 14.8%, compared with 8.1%, and earnings growth at 127.6%. Information Technology has expanded its margin from 27.5% to 32.3%. By contrast, six of the eleven sectors have posted year-on-year margin declines, among them Consumer Staples, Health Care and Consumer Discretionary. Although 48% of index companies now retain less profit per sales dollar than a year earlier, the overall margin has risen almost two points. The June quarter's record of 17% incorporated paper gains on Anthropic holdings at Alphabet (GOOG, GOOGL) and Amazon (AMZN). Consecutive quarters have therefore produced the two highest margins since 2009: one supported by an AI company's valuation, the other by a tanker war.
Why Did Margins Fall Last Time Even After Shoppers Paid?
Across seven months in 2021 and 2022, the spread exceeded today's level, reaching its widest point of 3.5 points in August 2021. As it approached that peak, the index's margin set a record of 13.1% in the June 2021 quarter. After six quarters, the margin had dropped to 11.2%, its weakest since 2020. Eight of the eleven sectors recorded year-on-year margin contractions in the December 2022 quarter. Energy moved the other way, increasing from 9.3% to 12.9%; it is repeating that performance now, but from a higher starting point.
It was a rise in consumer inflation that closed the gap. Companies passed on costs and the CPI reached 9% in June 2022, without preventing margins from declining. For eight months, producer-price inflation stayed at 10% or above; retail prices caught up only once that run ended. Between its January 2022 peak and October 2022 trough, the S&P 500 lost about 25%. What sets this episode apart is the Federal Reserve (Fed): during that market decline it increased rates from zero to above 4%, whereas it starts this episode near 4%, following a September 16 increase.
Who Can Pass On the Cost of Soap, Cigarettes and Pickup Trucks?
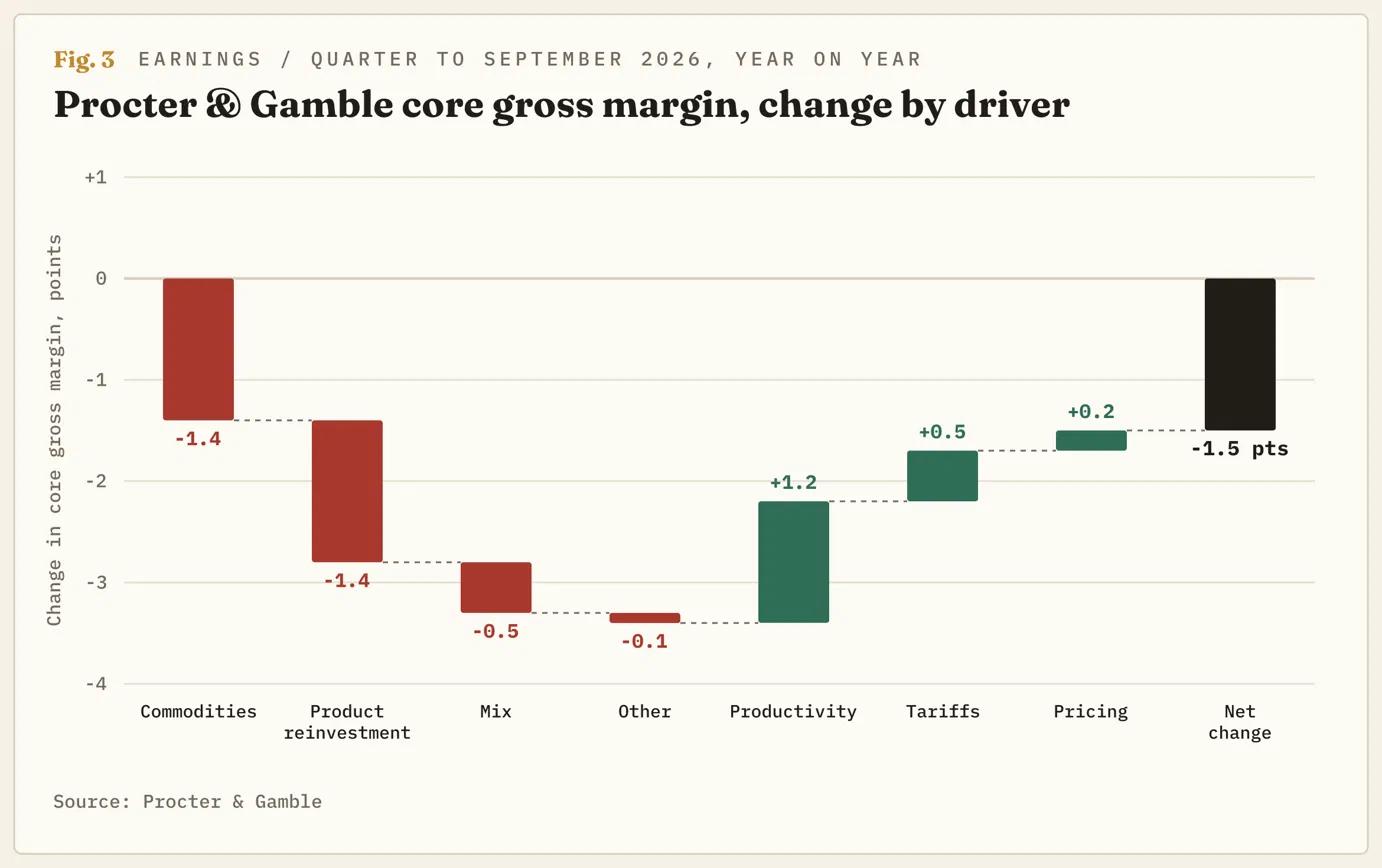
Procter & Gamble (PG), the index's biggest household-goods manufacturer, said on Thursday that sales had increased 4% in the quarter to September. Higher volumes contributed 2.4 points, with higher prices adding 0.4. Gross margin, the share of sales remaining after production costs, contracted 1.5 points. Commodity costs reduced it by 1.4 points, while pricing restored 0.2. Assuming Brent remains at $100, the company now projects an after-tax bill of $1.4 billion for raw materials, energy and freight this fiscal year, compared with its $1 billion expectation in July. Recovering that amount, Chief Financial Officer Andre Schulten said, "will take record productivity levels". He added that "the second component is pricing with innovation" and "the third component here is time".
With a margin of 6.3%, against 6.5% a year earlier, the index's Consumer Staples sector is following the same pattern: higher sales volumes at unchanged prices despite rising costs. Philip Morris International (PM), however, increased cigarette prices by 8.9% while shipping the same number of cigarettes as a year earlier, lifting gross profit by 6.7%. That is the pricing power nicotine provides. General Motors (GM) estimated its commodity, freight and memory-chip costs at about $2 billion this year, yet increased its North American margin by 2.5 points through the prices commanded by its trucks. Businesses unable to match those two companies bear the gap. September's PPI showed a 30.3% drop in the gasoline-retailing margin index alongside a 20.3% rise in gasoline prices. Nowhere else in the release is the gap so directly absorbed.
When Will the Third Component, Time, Take Effect?
For Procter & Gamble, the commodity bill represented 5% of earnings in the quarter just reported, against 8% for the full year. More of that burden falls in the remaining three quarters than in the first. Price increases intended to recoup it are "generally timed with modular resets", when retailers rearrange their shelves, pushing their effect on the CPI into 2027. According to Schulten, "there is no way to recover this level of commodity pressure without pricing", and "the industry generally is pricing up". On the same call, he also said, "I cannot announce pricing, and I will not announce pricing in any way, shape, or form."
For 2027, analysts project S&P 500 earnings growth of 16% alongside a 9.5% increase in revenue, implying another expansion in margins. Yet the index's soap, cigarette and truck manufacturers say they enter the year facing higher costs than a year earlier. The index trades at 19 times forecast earnings for the next twelve months, marginally below its five-year average. That leaves the forecast, rather than the valuation placed on it, as the source of risk. When the Fed meets on October 28, most committee members will already have publicly indicated that they expect another rate increase by year-end. The price increases arriving in 2027 will feed into the CPI that the Fed is seeking to restrain with higher rates. Companies, meanwhile, will commit to no date beyond the next shelf reset.
What Does the Chart Signal?
About half the advance from September's low to the October 6 record has been surrendered by the S&P 500. For the second time since September, it is trading slightly below its 50-day average. Before this week's results, the daily Stochastic Relative Strength Index (Stoch RSI), a momentum indicator, had already turned lower from near 70. The retreat therefore began before results from Procter & Gamble. Since the March low, the chart has traced successive higher lows above an ascending 50-day average, with a ceiling at 7,800 breached only during the record-setting move. The key dividing level is 7,700, where that average sits.
Closing levels below 7,700 leave the bias pointing downwards. The initial test comes at 7,500, September's trough and the latest higher low in the sequence. A close beneath it would mark the first lower low since March. Near 7,300, the 200-day average marks the point at which the 2022 experience of six quarters of shrinking margins becomes the chart's base case, rather than merely a historical comparison. A daily close above 7,800 would invalidate that case. Such a move would mean investors were valuing energy and technology margins while looking past the other nine sectors. Alternatively, falling oil prices could narrow the gap from the top, reducing consumer companies' costs before eroding energy-sector profits. October's CPI is due on November 10, followed by the PPI on November 13. A spread that closes through lower producer inflation is the outcome the index can afford.
POPULAR ARTICLES
1Indonesian Rupiah: Is It Finding Stability Despite MSCI Risks? - DBS2USD/CHF Price Forecast: Can bulls maintain their defence of the 50-day SMA near 0.8200?3Chinese Yuan: 6.6640 Against US Dollar in Sight as Gains Build Gradually – UOB4Silver Price Forecast: Can bears push XAG/USD towards $50 after breaking $55?5Why is gold falling as US Treasuries attract safe-haven demand despite lower yields?6South Korean Won: Gains Against US Dollar Find Support in Hawkish BoK Hold – Societe Generale7European Central Bank: Why gradual tightening signals a December rate hike – Rabobank8Forex Today: What Will PMIs Day Bring?9Easing third-quarter inflation weighs on New Zealand Dollar
LIVE QUOTES


ALL ABOUT FOREX
What Is a Stop Loss, How Does It Work and How Do You Set One?
Margin Call Meaning: What It Is, What Triggers It, and How to Avoid One
What Is an Islamic Account in Forex?
Best Indicators for Forex Trading and How to Use Them
The Top 10 Most Traded Currency Pairs in the World
What are the Major Forex Pairs? 7 Major Currency Pairs in the World
5 Best Forex Trading Apps In India In 2026
Top 15 Weakest Currencies in the World
Best Time to Trade Forex
Get Started!
Sign up and access the Global Markets in less than 3 minutes

Connect With Us









Contacts
Phone: +61 2 8036 8388
Fax: +61 2 8036 8388
Email: support@tmgm.com



The information provided on this website is of a general nature only and does not constitute personal financial advice. Before acting on any information on this website, you should consider the suitability of the information in relation to your objectives, financial situation and needs. Investing in CFDs and FX Margin Contracts carries significant risks and is not suitable for all investors. You may lose more than your initial deposit. You do not own, or have, any interest in the underlying asset. We recommend that you seek independent advice and ensure you fully understand the risks involved before trading. It is important that you read and consider the disclosure document before you acquire any product listed on the website. The information and advertisements offered on this website are not intended for use by any person in any country or jurisdiction where such use would be contrary to local laws and regulations. The Products and Services offered on this website are not intended for residents of the United States, Malaysia and Thailand.
TMGM is authorized and regulated in various jurisdictions.
Trademax Australia Limited, trading as TMGM, is regulated by the Australian Securities and Investments Commission (ASIC), AFSL no. 436416 and is located at Level 28, One International Tower, 100 Barangaroo Avenue, 2000 Sydney, NSW Australia.
Email: support@tmgm.com.au
Trademax Global Limited, trading as TMGM, is authorized and regulated by the Vanuatu Financial Services Commission (VFSC), registration number 40356 and registered at 1276, Kumul Highway, Port Vila, Vanuatu, Republic of Vanuatu.
Email: support@tmgm.com
Trademax Global Markets (SE) Limited, trading as TMGM, is authorized and regulated by the Financial Services Authority (FSA) of Seychelles, with license number SD224. The company is registered at Office No 13, Providence Estate ABIS Centre, Mahe, Seychelles.
Email: support@tmgm.com
Trademax Global Markets (International) Pty Ltd, trading as TMGM, is authorized and regulated by the Financial Services Commission, Mauritius (FSC) with license no. GB22201012, and registered at 33, Edith Cavell Street C/o IQ EQ Fund Services (Mauritius) Ltd Port Louis, 11324 Mauritius.
Email: support@tmgm.com
Copyright © TMGM. All rights reserved