

Trading
Explore a wide range of markets with competitive pricing, deep liquidity, and advanced trading tools.
Learn More 
Platform
Trade seamlessly with TMGM's powerful platform, built for speed, precision, and a superior trading experience.
Learn More Trading Platform
Academy
Learn the fundamentals of trading with beginner-friendly resources, including guides, webinars, and market insights.
Learn More News & Analysis
Get real-time market updates and expert analysis to stay ahead of trading opportunities
Learn More News & Analysis
About
Learn what sets TMGM apart — our global presence, regulatory strength, and commitment to innovation in trading.
Learn More Why Choose TMGM
Sponsorship
Solana Price Forecast: Is SOL facing greater downside risk after slipping below $92?
- Selling pressure keeps Solana below $92 on Wednesday as its correction deepens, taking losses so far this week to over 3.5%.
- SOL's recovery remains constrained by subdued ETF demand, a build-up in short positions and increasingly overheated market conditions.
- SOL remains exposed to a sharper correction as weakening technical signals point to additional downside risk.
Bearish sentiment continues to restrain Solana (SOL), which trades below $92 on Wednesday after losing more than 3.5% so far this week. Recovery efforts remain limited by subdued demand for US-listed spot Solana Exchange-Traded Funds (ETFs), an increase in short positions and overheated market conditions. Adding to the pressure, weakening technical signals suggest further downside risk and leave SOL exposed to a more pronounced correction.

Are weakening metrics holding back Solana’s recovery?
With losses exceeding 3.5% so far this week, Solana fell below $92 on Wednesday. The decline puts it on course for a sixth consecutive losing week since late September.
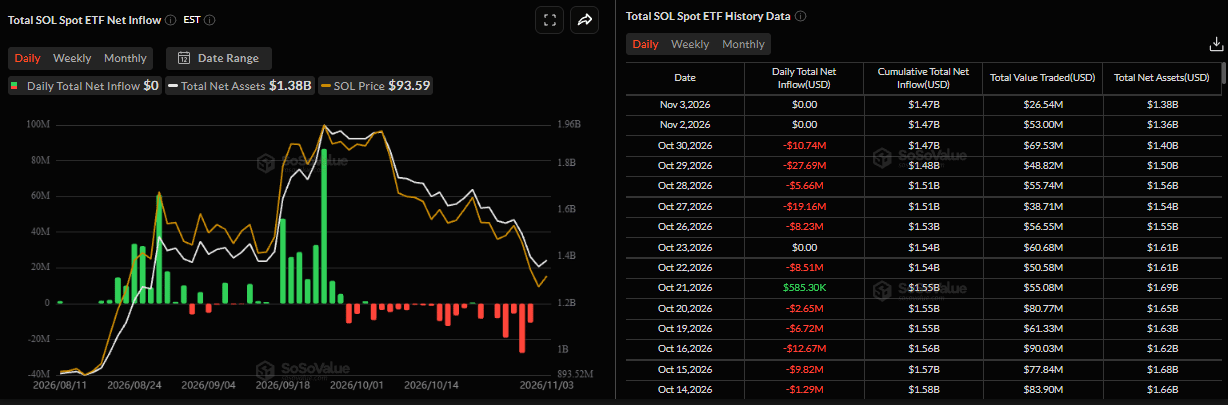
Following last week’s largest weekly withdrawals since launch, activity in SOL’s spot Exchange-Traded Funds (ETFs) has been largely muted so far this week, according to SoSoValue data. The figures suggest that meaningful institutional demand for the token is lacking, leaving falling SOL prices without support from ETF demand.
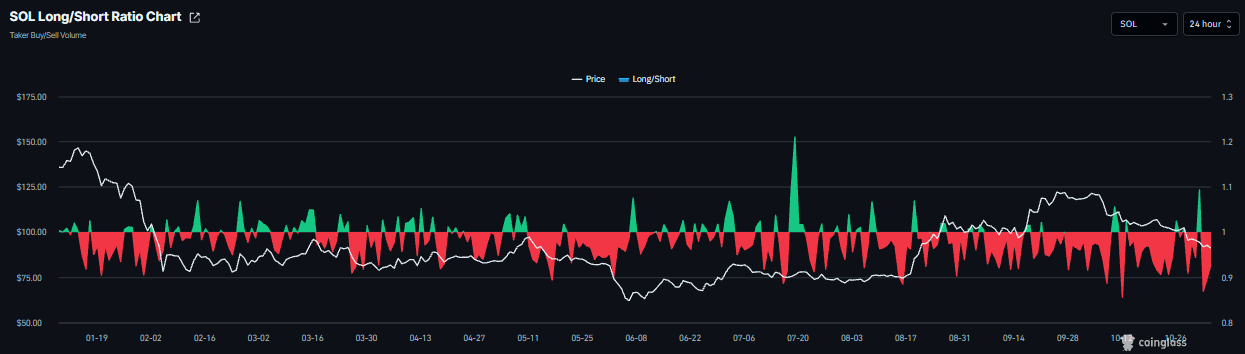
Bearish positioning is also evident in derivatives, with CoinGlass reporting a SOL long-to-short ratio of 0.92 on Wednesday, close to its lowest reading in over a month. Readings below one signal bearish sentiment, reflecting traders’ bets on a fall in asset prices.
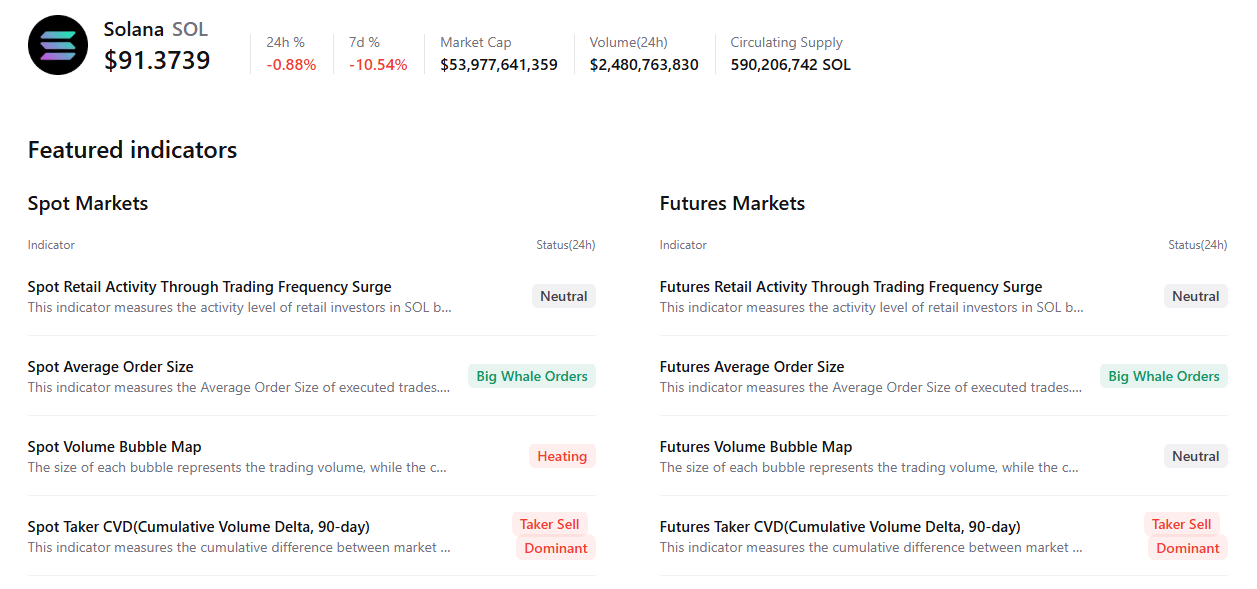
A cautious picture also emerges from CryptoQuant’s summary data: large whale orders feature in SOL’s spot and futures markets, where sellers dominate. Overheating is evident in the spot market as well. Together, these indicators suggest a cautious, bearish bias among Solana traders that continues to constrain its recovery.
Solana technical outlook: Are bulls losing their grip?
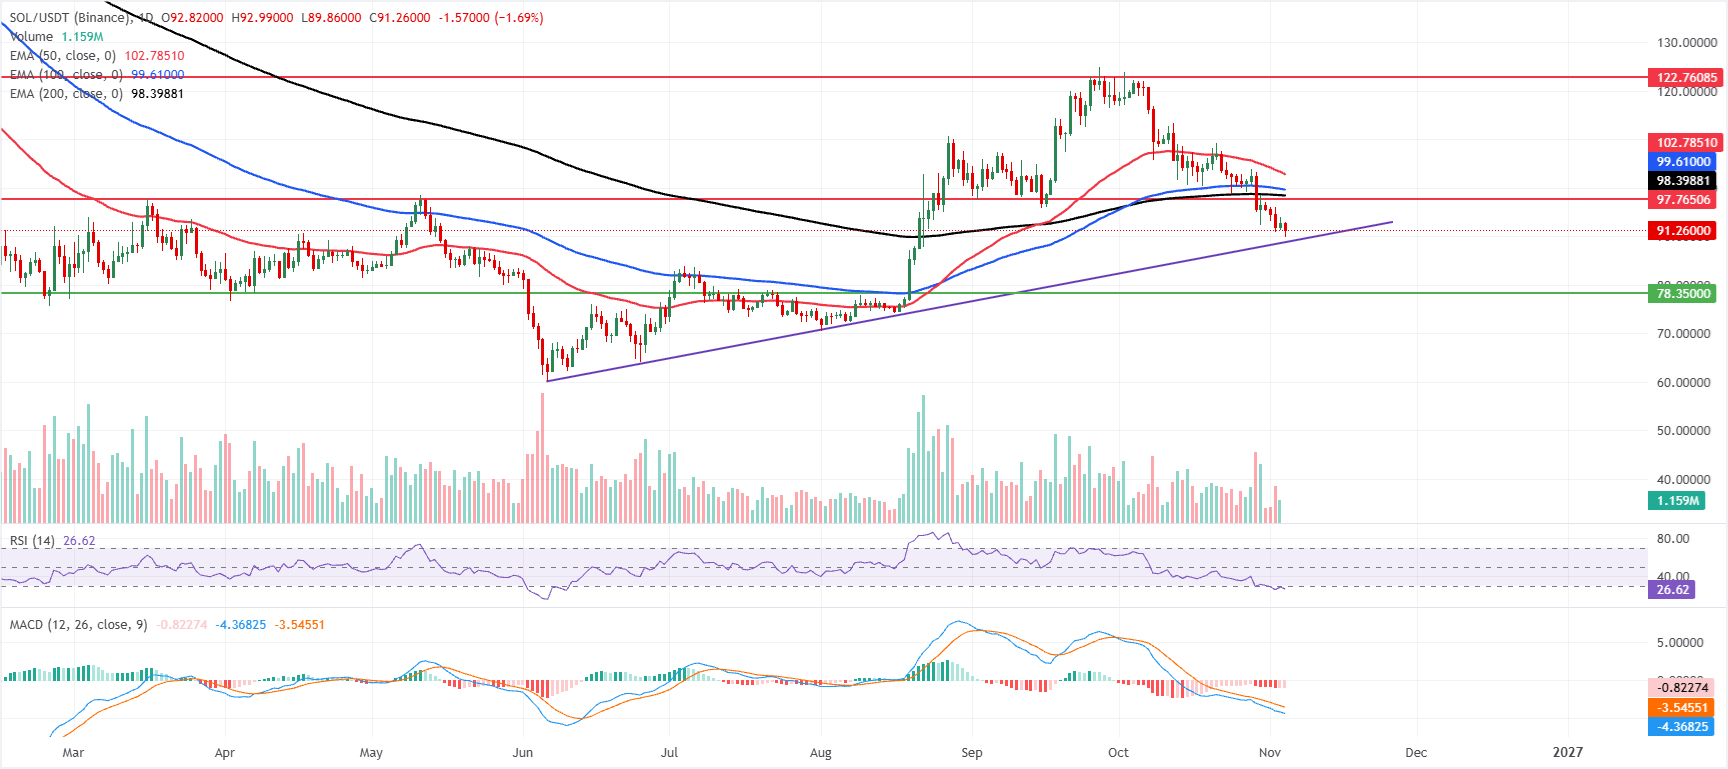
Below its key Exponential Moving Averages (EMAs), Solana retains a bearish near-term bias while trading at $91.26 on Wednesday. Successive layers of overhead resistance come from the 50-day EMA at $102.78, the 100-day EMA at $99.61 and the 200-day EMA at $98.39, signalling that the recent decline remains intact.
Weakness persists across momentum indicators. The Relative Strength Index (RSI) sits near 26 in oversold territory, while the Moving Average Convergence Divergence (MACD) line remains firmly below zero. Both reinforce the prevailing downward pressure, even as market conditions begin to appear stretched.
Any recovery would first encounter the horizontal resistance around $97.76, ahead of the 200-day EMA at $98.39 and the 100-day EMA at $99.61. A firmer hurdle lies at the 50-day EMA of $102.78, before the higher horizontal barrier at $122.76.
For a further decline, the current price region serves as the immediate reference point. The earlier rising trendline dynamics now lead back towards the break zone around $88.80, followed by more significant horizontal support near $78.35. Buyers would be expected to show greater interest at that lower level if the sell-off continues.
(The technical analysis of this story was written with the help of an AI tool. Know more.)
POPULAR ARTICLES
1Equities: How are Democratic gains shaping global market reactions? – Deutsche Bank2NZD/USD: Key support stands at 0.55603US Dollar: How is the Blue wave reshaping growth and risk? – Commerzbank4Euro: Does the upside bias favour a move towards 1.1250 against US Dollar? – UOB5Solana Price Forecast: Is SOL facing greater downside risk after slipping below $92?6US Dollar pressure from US midterm elections lifts Indian Rupee further7Swiss Franc gathers pace amid US Dollar weakness after US midterm elections8EUR/USD Price Forecast: Gains above 1.1200 face a ceiling below the 100-day SMA9With Democrats targeting victory in both Houses, Australian Dollar recovers

Get Started!
Sign up and access the Global Markets in less than 3 minutes

Connect With Us









Contacts
Phone: +61 2 8036 8388
Fax: +61 2 8036 8388
Email: support@tmgm.com



The information provided on this website is of a general nature only and does not constitute personal financial advice. Before acting on any information on this website, you should consider the suitability of the information in relation to your objectives, financial situation and needs. Investing in CFDs and FX Margin Contracts carries significant risks and is not suitable for all investors. You may lose more than your initial deposit. You do not own, or have, any interest in the underlying asset. We recommend that you seek independent advice and ensure you fully understand the risks involved before trading. It is important that you read and consider the disclosure document before you acquire any product listed on the website. The information and advertisements offered on this website are not intended for use by any person in any country or jurisdiction where such use would be contrary to local laws and regulations. The Products and Services offered on this website are not intended for residents of the United States, Malaysia and Thailand.
TMGM is authorized and regulated in various jurisdictions.
Trademax Australia Limited, trading as TMGM, is regulated by the Australian Securities and Investments Commission (ASIC), AFSL no. 436416 and is located at Level 28, One International Tower, 100 Barangaroo Avenue, 2000 Sydney, NSW Australia.
Email: support@tmgm.com.au
Trademax Global Limited, trading as TMGM, is authorized and regulated by the Vanuatu Financial Services Commission (VFSC), registration number 40356 and registered at 1276, Kumul Highway, Port Vila, Vanuatu, Republic of Vanuatu.
Email: support@tmgm.com
Trademax Global Markets (SE) Limited, trading as TMGM, is authorized and regulated by the Financial Services Authority (FSA) of Seychelles, with license number SD224. The company is registered at Office No 13, Providence Estate ABIS Centre, Mahe, Seychelles.
Email: support@tmgm.com
Trademax Global Markets (International) Pty Ltd, trading as TMGM, is authorized and regulated by the Financial Services Commission, Mauritius (FSC) with license no. GB22201012, and registered at 33, Edith Cavell Street C/o IQ EQ Fund Services (Mauritius) Ltd Port Louis, 11324 Mauritius.
Email: support@tmgm.com
Copyright © TMGM. All rights reserved