

Trading
Explore a wide range of markets with competitive pricing, deep liquidity, and advanced trading tools.
Learn More 
Platform
Trade seamlessly with TMGM's powerful platform, built for speed, precision, and a superior trading experience.
Learn More Trading Platform
Academy
Learn the fundamentals of trading with beginner-friendly resources, including guides, webinars, and market insights.
Learn More News & Analysis
Get real-time market updates and expert analysis to stay ahead of trading opportunities
Learn More News & Analysis
About
Learn what sets TMGM apart — our global presence, regulatory strength, and commitment to innovation in trading.
Learn More Why Choose TMGM
Sponsorship
USD/JPY Price Forecast: Can a bullish pin bar break through the 200-day SMA barrier?
- Below resistance at the 200-day SMA, USD/JPY shows a possible bullish pin bar.
- Buying momentum weakens as the RSI heads lower despite remaining in bullish territory.
- Above 159.00, 159.16 comes into focus; a break below 157.39 puts 156.08 at risk.
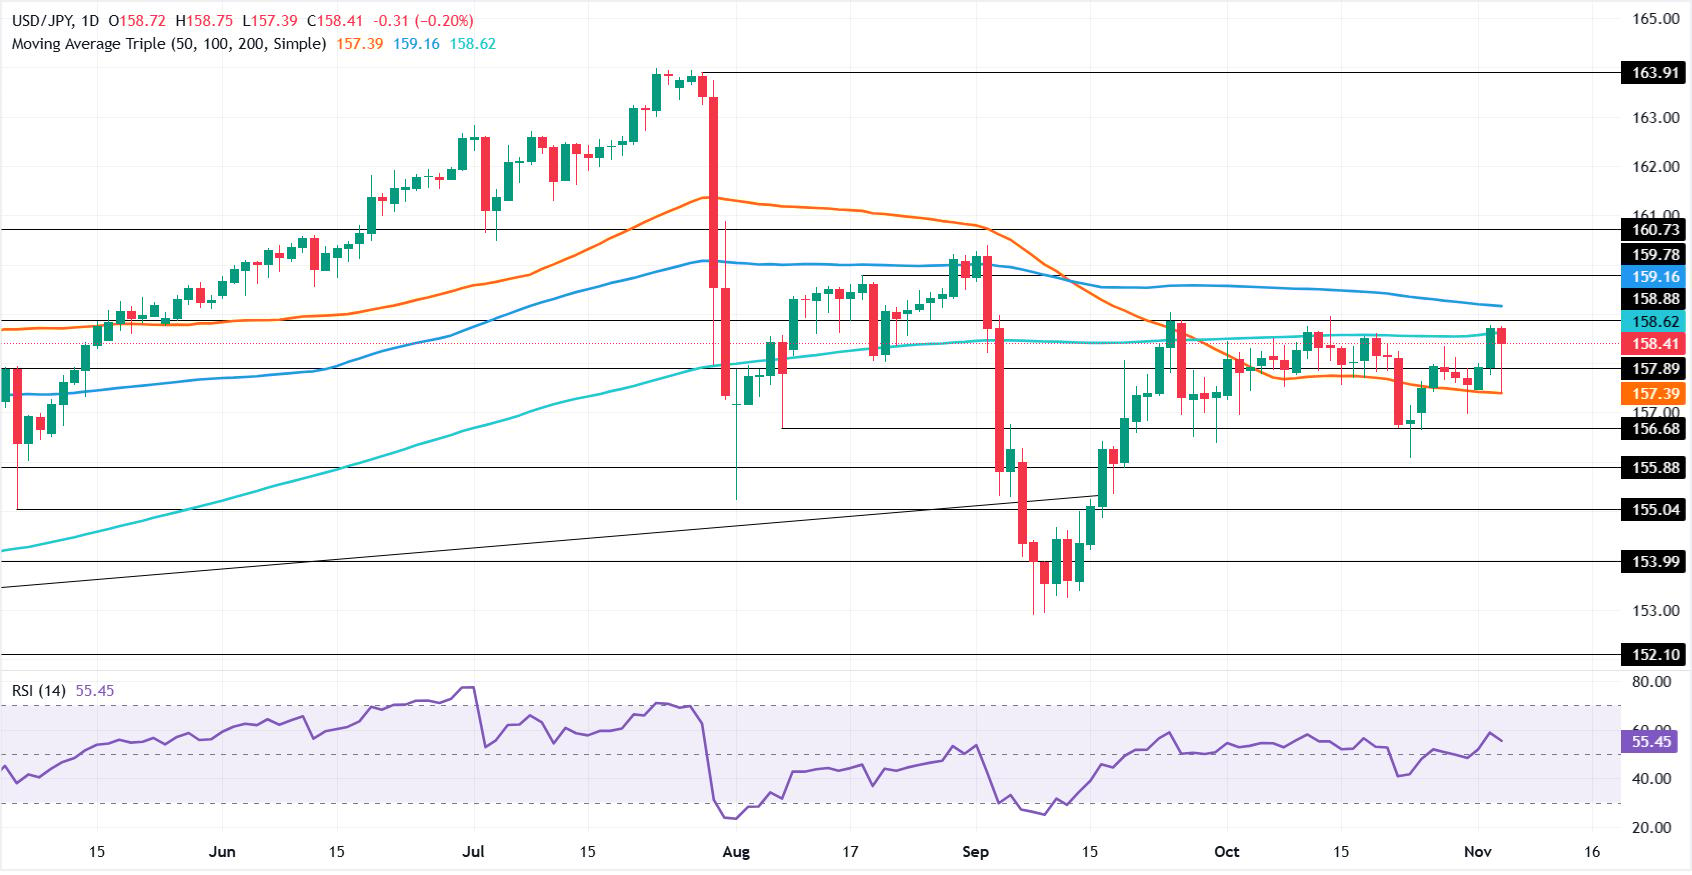
Selling pressure on USD/JPY has eased from earlier levels, although the pair remains down 0.20% following the US midterm election results. A tilted bullish ‘pin bar’ appears to be taking shape, but consolidation continues between the 50- and 200-day SMAs at 157.39 and 158.62, respectively. The pair is trading at 158.41 at the time of writing.

USD/JPY Price Forecast: Can Buyers Overcome the Bearish Structure?
With no clear directional bias, USD/JPY continues to trade on a subdued note. Lower highs and lower lows still define the market structure. A recovery above 159.00, however, could bring the 100-day SMA at 159.16 into play, as buyers look for a test of 160.00.
Momentum offers little support for such a move: while the Relative Strength Index (RSI) remains bullish, it is pointing lower. Nevertheless, should USD/JPY rise above 160.00, a subsequent break above the 2 September high of 160.39 could allow buyers to invalidate the bearish market structure.
For the downtrend to extend, sellers would first need to push USD/JPY below 158.00 and then break through the 50-day SMA at 157.39. Losing that moving average would put 157.00 in focus, followed by the 23 October low of the day (LOD) at 156.08 as the next level in sellers’ sights.
USD/JPY Daily Price Chart
How Is the Japanese Yen Performing Today?
The Japanese Yen recorded its strongest performance against the US Dollar today. The table below sets out the Japanese Yen’s (JPY) percentage moves against the major currencies listed.
| USD | EUR | GBP | JPY | CAD | AUD | NZD | CHF | |
|---|---|---|---|---|---|---|---|---|
| USD | -0.37% | -0.44% | -0.21% | -0.27% | -0.54% | -0.22% | -0.52% | |
| EUR | 0.37% | -0.06% | 0.20% | 0.13% | -0.16% | 0.20% | -0.15% | |
| GBP | 0.44% | 0.06% | 0.23% | 0.17% | -0.10% | 0.23% | -0.09% | |
| JPY | 0.21% | -0.20% | -0.23% | -0.07% | -0.34% | -0.03% | -0.33% | |
| CAD | 0.27% | -0.13% | -0.17% | 0.07% | -0.27% | 0.04% | -0.26% | |
| AUD | 0.54% | 0.16% | 0.10% | 0.34% | 0.27% | 0.32% | 0.02% | |
| NZD | 0.22% | -0.20% | -0.23% | 0.03% | -0.04% | -0.32% | -0.29% | |
| CHF | 0.52% | 0.15% | 0.09% | 0.33% | 0.26% | -0.02% | 0.29% |
Percentage movements between major currencies are displayed in the heat map. Select the base currency in the left-hand column and the quote currency in the top row. To read JPY (base)/USD (quote), for instance, choose the Japanese Yen on the left and follow its row across to the US Dollar; the intersecting cell gives the percentage change for that pair.
POPULAR ARTICLES
1USD/JPY Price Forecast: Can a bullish pin bar break through the 200-day SMA barrier?2US Dollar sinks on blue wave sweep as Aussie Dollar retakes 0.70003Hong Kong: Growth prospects brighten – UOB4How is a Democratic sweep driving Mexican Peso gains ahead of Banxico’s decision?5Chinese Yuan: How is the PBoC tempering Yuan gains? – MUFG6How did ARC presale lift Q3 revenue despite an 8% drop in Circle’s reserve income?7Singapore Dollar: Narrow trading range persists as PMI backs growth – Commerzbank8Ethereum Price Forecast: What next as ETH retakes $2,400 after US midterms?9ECB’s Moulin: Higher rates manageable for banks; France must repair its finances

Get Started!
Sign up and access the Global Markets in less than 3 minutes

Connect With Us









Contacts
Phone: +61 2 8036 8388
Fax: +61 2 8036 8388
Email: support@tmgm.com



The information provided on this website is of a general nature only and does not constitute personal financial advice. Before acting on any information on this website, you should consider the suitability of the information in relation to your objectives, financial situation and needs. Investing in CFDs and FX Margin Contracts carries significant risks and is not suitable for all investors. You may lose more than your initial deposit. You do not own, or have, any interest in the underlying asset. We recommend that you seek independent advice and ensure you fully understand the risks involved before trading. It is important that you read and consider the disclosure document before you acquire any product listed on the website. The information and advertisements offered on this website are not intended for use by any person in any country or jurisdiction where such use would be contrary to local laws and regulations. The Products and Services offered on this website are not intended for residents of the United States, Malaysia and Thailand.
TMGM is authorized and regulated in various jurisdictions.
Trademax Australia Limited, trading as TMGM, is regulated by the Australian Securities and Investments Commission (ASIC), AFSL no. 436416 and is located at Level 28, One International Tower, 100 Barangaroo Avenue, 2000 Sydney, NSW Australia.
Email: support@tmgm.com.au
Trademax Global Limited, trading as TMGM, is authorized and regulated by the Vanuatu Financial Services Commission (VFSC), registration number 40356 and registered at 1276, Kumul Highway, Port Vila, Vanuatu, Republic of Vanuatu.
Email: support@tmgm.com
Trademax Global Markets (SE) Limited, trading as TMGM, is authorized and regulated by the Financial Services Authority (FSA) of Seychelles, with license number SD224. The company is registered at Office No 13, Providence Estate ABIS Centre, Mahe, Seychelles.
Email: support@tmgm.com
Trademax Global Markets (International) Pty Ltd, trading as TMGM, is authorized and regulated by the Financial Services Commission, Mauritius (FSC) with license no. GB22201012, and registered at 33, Edith Cavell Street C/o IQ EQ Fund Services (Mauritius) Ltd Port Louis, 11324 Mauritius.
Email: support@tmgm.com
Copyright © TMGM. All rights reserved