

Trading
Explore a wide range of markets with competitive pricing, deep liquidity, and advanced trading tools.
Learn More 
Platform
Trade seamlessly with TMGM's powerful platform, built for speed, precision, and a superior trading experience.
Learn More Trading Platform
Academy
Learn the fundamentals of trading with beginner-friendly resources, including guides, webinars, and market insights.
Learn More News & Analysis
Get real-time market updates and expert analysis to stay ahead of trading opportunities
Learn More News & Analysis
About
Learn what sets TMGM apart — our global presence, regulatory strength, and commitment to innovation in trading.
Learn More Why Choose TMGM
Sponsorship
British Pound holds its ground as US Consumer Sentiment deteriorates
- GBP/USD trades near 1.3231 as the Dollar edges higher.
- US Consumer Sentiment Index drops to 46.3 in October.
- One-year inflation expectations rise to 4.7%, reinforcing Fed concerns.
The Pound Sterling holds firm against the US Dollar, which has so far posted modest gains against a basket of six currencies, while US consumers grew pessimistic about the economy as the US-Iran conflict dragged on for another week. The GBP/USD trades at 1.3231 at the time of writing.
Sterling steadies despite high US Treasury yields; inflation expectations climb across US households

The US Dollar Index (DXY), which measures the performance of the US dollar against its peers, is up 0.16% to 102.27.
Data from the University of Michigan showed the Consumer Sentiment Index in October diving from 48.1 in September to 46.3, missing forecasts of 46.3. The report showed that the economy’s trajectory has weakened since the start of 2026. US households upwardly revised inflation expectations for one year to 4.7% from 4.6%, and for a five-year period to 3.5% from 3.4%.
Market participants' attention shifts to the release of US inflation in the consumer and producer sectors. Also, Retail Sales, further jobs data, and Fed speakers could dictate the path of interest rates as the October FOMC meeting looms.
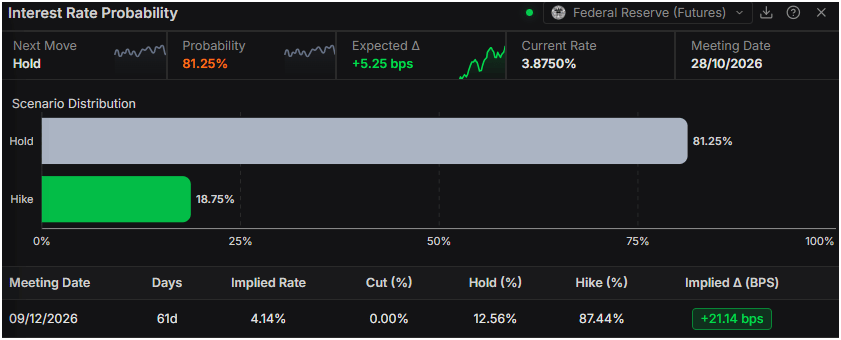
Fed interest rate expectations remain unchanged for October, with investors seeing a 81% chance of keeping rates unchanged. For the December meeting, they expect 21 basis points of tightening, with the odds for an increase being at 87%, revealed Prime Terminal.
In the meantime, US Treasury yields continue to rise, indicating that investors continue to price a higher premium due to expectations of higher living costs.
In the UK, eyes are on high energy prices, and investors are bracing for the release of Chancellor John Healey’s Autumn Budget.
The schedule will feature UK Retail Sales, a speech by the BoE Chief Economist Pill and the release of GDP figures.
GBP/USD Price Forecast: Technical outlook
In the daily chart, GBP/USD trades at 1.3229, keeping a bearish near‑term tone as spot remains decisively below the cluster of longer‑term simple moving averages around 1.3439 and a series of former rising trend‑line supports now acting as overhead barriers near 1.3360 and above. The Relative Strength Index (14) at 38.47 stays on the soft side of neutral, which hints at lingering downside pressure while falling short of oversold extremes, suggesting sellers retain control unless price can reclaim the mentioned structural caps.
On the topside, initial resistance is located at the broken upward trend line coming in around 1.3360, followed by the grouped 50/100/200‑day simple moving averages near 1.3439, which reinforce the broader bearish bias. Above there, a prior descending resistance line caps the market around 1.3508, with another downtrend barrier near 1.3544 and a higher former support trend line turned resistance around 1.3606, levels that would need to be cleared to alleviate the current downside pressure; with no nearby supports mapped below spot from this dataset, any fresh lows would leave the pair exposed to further bearish extension until a new base is formed.
(The technical analysis of this story was written with the help of an AI tool. Know more.)
Top Articles
1Asia FX: Trade negotiations and resilient macro backdrop – MUFG2Singapore: Policy slope tightening view – DBS3Canada loses 68.3K jobs and the Loonie falls to an 18-month low4British Pound holds its ground as US Consumer Sentiment deteriorates5France: Budget politics and market testing – Rabobank6Bitcoin and Gold Outlook: BTC reclaims $82K, XAU approaches $4,200 as October rate hike bets dim7Euro struggles as French fiscal concerns and firm US Dollar dominate8New Zealand Dollar edges higher on softer US yields, Fed hike bets cap recovery9Japan: Bond outflows reshape global yields - Commerzbank
LIVE QUOTES


Get Started!
Sign up and access the Global Markets in less than 3 minutes

Connect With Us









Contacts
Phone: +61 2 8036 8388
Fax: +61 2 8036 8388
Email: support@tmgm.com



The information provided on this website is of a general nature only and does not constitute personal financial advice. Before acting on any information on this website, you should consider the suitability of the information in relation to your objectives, financial situation and needs. Investing in CFDs and FX Margin Contracts carries significant risks and is not suitable for all investors. You may lose more than your initial deposit. You do not own, or have, any interest in the underlying asset. We recommend that you seek independent advice and ensure you fully understand the risks involved before trading. It is important that you read and consider the disclosure document before you acquire any product listed on the website. The information and advertisements offered on this website are not intended for use by any person in any country or jurisdiction where such use would be contrary to local laws and regulations. The Products and Services offered on this website are not intended for residents of the United States, Malaysia and Thailand.
TMGM is authorized and regulated in various jurisdictions.
Trademax Australia Limited, trading as TMGM, is regulated by the Australian Securities and Investments Commission (ASIC), AFSL no. 436416 and is located at Level 28, One International Tower, 100 Barangaroo Avenue, 2000 Sydney, NSW Australia.
Email: support@tmgm.com.au
Trademax Global Limited, trading as TMGM, is authorized and regulated by the Vanuatu Financial Services Commission (VFSC), registration number 40356 and registered at 1276, Kumul Highway, Port Vila, Vanuatu, Republic of Vanuatu.
Email: support@tmgm.com
Trademax Global Markets (SE) Limited, trading as TMGM, is authorized and regulated by the Financial Services Authority (FSA) of Seychelles, with license number SD224. The company is registered at Office No 13, Providence Estate ABIS Centre, Mahe, Seychelles.
Email: support@tmgm.com
Trademax Global Markets (International) Pty Ltd, trading as TMGM, is authorized and regulated by the Financial Services Commission, Mauritius (FSC) with license no. GB22201012, and registered at 33, Edith Cavell Street C/o IQ EQ Fund Services (Mauritius) Ltd Port Louis, 11324 Mauritius.
Email: support@tmgm.com
Copyright © TMGM. All rights reserved