

Trading
Explore a wide range of markets with competitive pricing, deep liquidity, and advanced trading tools.
Learn More 
Platform
Trade seamlessly with TMGM's powerful platform, built for speed, precision, and a superior trading experience.
Learn More Trading Platform
Academy
Learn the fundamentals of trading with beginner-friendly resources, including guides, webinars, and market insights.
Learn More News & Analysis
Get real-time market updates and expert analysis to stay ahead of trading opportunities
Learn More News & Analysis
About
Learn what sets TMGM apart — our global presence, regulatory strength, and commitment to innovation in trading.
Learn More Why Choose TMGM
Sponsorship
Ethereum Price Forecast: ETH drops near $2,200 after Binance hack
Ethereum price today: $2,230
- Ethereum declines near $2,200 on Friday, triggering over $350 million in liquidations as derivatives flip bearish.
- The top altcoin is under pressure from risk-off sentiment following a $6.3 billion Binance hack and selloffs in tech stocks.
- ETH eyes support at $2,204 after falling below the $2,256 horizontal level.
Ethereum (ETH) drops toward $2,200 on Friday as the crypto market remains weighed down by the Binance hack and tech selloffs.
Binance hack and tech selloffs fuel ETH selling

The top altcoin has seen intense selling pressure across spot and futures venues over the past day, pulling its price from $2,330 to $2,177 before recovering above $2,200. The move triggered Ethereum futures liquidations worth $350 million in the past 24 hours, driven by over $311 million in long liquidations, per Coinglass data.
Heavy liquidations pushed funding rates to -0.0105, the lowest level since early June. The flip to negative territory indicates short positions have gained dominance in ETH perpetual futures.
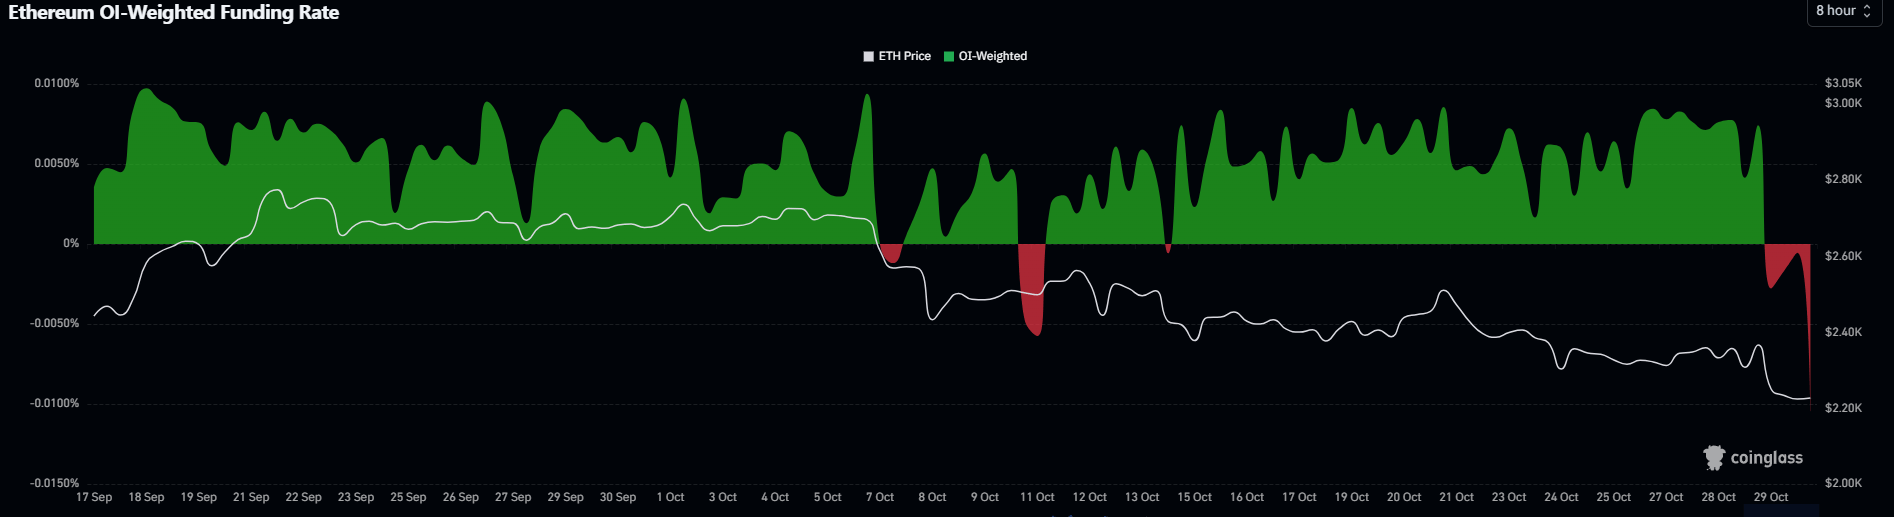
Funding rates are periodic payments between long and short traders in perpetual futures markets to keep a contract's price anchored to its underlying spot counterpart.
Ethereum's open interest, the total worth of outstanding contracts in a derivatives market, declined by 410,000 ETH to 12.61 million ETH.
On the spot side, US spot ETH exchange-traded funds (ETFs) continued their weakness, posting $105.48 million in net outflows on Thursday. The products are on track for their worst month on record, with outflows worth $1.45 billion so far in October, surpassing the $1.42 billion withdrawals in November 2025.
The risk-off sentiment follows Thursday's $6.3 billion hack on crypto exchange Binance. Partners froze $3 billion of the stolen funds while Binance paused withdrawals.
The exchange said it will cover the stolen assets with its own funds and may resume withdrawals in 48 hours.
Aside from the hack, selloffs in tech stocks are also weighing on the crypto market, which has shown a rising positive correlation with the tech-heavy Nasdaq in the past few months. The index dropped 3.3% on Friday alongside a 2.1% decline in the S&P 500 at the time of writing.
Risk assets remain pressured as rising inflation and expectations of a Federal Reserve (Fed) rate hike in December keep investors on edge.
Ethereum technical outlook: ETH eyes $2,204 support after decline below $2,256
On the daily chart, ETH is keeping a bearish near-term tone as it remains capped beneath all key Exponential Moving Averages (EMAs). Momentum reinforces the downside bias, with the 14-day Relative Strength Index (RSI) slipping into oversold territory near 29 and the Stochastic Oscillator hovering around 17, suggesting that while selling pressure dominates, the top altcoin could be approaching a short-term exhaustion phase rather than a clear reversal.
On the topside, initial resistance emerges at the horizontal barrier near $2,257, followed by $2,355 and then the EMA cluster starting at the 100-day EMA around $2,351 and extending toward the 50-day EMA near $2,435. Above these, higher hurdles are seen at $2,549, $2,637 and $2,782.
On the downside, immediate support is located at $2,205, ahead of a secondary floor at $2,107, with deeper levels at $1,972 and $1,828 likely to attract buyers if the current slide extends.
(The technical analysis of this story was written with the help of an AI tool. Know more.)
Top Articles
1Ethereum Price Forecast: ETH drops near $2,200 after Binance hack2Gold breaks $3,886 floor to new YTD low as Fed hawks press on3Vietnam: Strong growth complicates inflation fight – DBS4Chinese Yuan: Uptrend extends toward 6.6450 against US Dollar – UOB5Japanese Yen holds firm after BoJ’s hawkish hold6Singapore Dollar: Rebound seen relatively capped against US Dollar – OCBC7Fed’s Logan calls for two more rate hikes; pause won’t alter path8Thai Baht: BoT cautious on normalisation, downside persists – Commerzbank9Forecasting the upcoming week: US Midterm Elections, Payrolls and the BoE in the spotlight


Get Started!
Sign up and access the Global Markets in less than 3 minutes

Connect With Us









Contacts
Phone: +61 2 8036 8388
Fax: +61 2 8036 8388
Email: support@tmgm.com



The information provided on this website is of a general nature only and does not constitute personal financial advice. Before acting on any information on this website, you should consider the suitability of the information in relation to your objectives, financial situation and needs. Investing in CFDs and FX Margin Contracts carries significant risks and is not suitable for all investors. You may lose more than your initial deposit. You do not own, or have, any interest in the underlying asset. We recommend that you seek independent advice and ensure you fully understand the risks involved before trading. It is important that you read and consider the disclosure document before you acquire any product listed on the website. The information and advertisements offered on this website are not intended for use by any person in any country or jurisdiction where such use would be contrary to local laws and regulations. The Products and Services offered on this website are not intended for residents of the United States, Malaysia and Thailand.
TMGM is authorized and regulated in various jurisdictions.
Trademax Australia Limited, trading as TMGM, is regulated by the Australian Securities and Investments Commission (ASIC), AFSL no. 436416 and is located at Level 28, One International Tower, 100 Barangaroo Avenue, 2000 Sydney, NSW Australia.
Email: support@tmgm.com.au
Trademax Global Limited, trading as TMGM, is authorized and regulated by the Vanuatu Financial Services Commission (VFSC), registration number 40356 and registered at 1276, Kumul Highway, Port Vila, Vanuatu, Republic of Vanuatu.
Email: support@tmgm.com
Trademax Global Markets (SE) Limited, trading as TMGM, is authorized and regulated by the Financial Services Authority (FSA) of Seychelles, with license number SD224. The company is registered at Office No 13, Providence Estate ABIS Centre, Mahe, Seychelles.
Email: support@tmgm.com
Trademax Global Markets (International) Pty Ltd, trading as TMGM, is authorized and regulated by the Financial Services Commission, Mauritius (FSC) with license no. GB22201012, and registered at 33, Edith Cavell Street C/o IQ EQ Fund Services (Mauritius) Ltd Port Louis, 11324 Mauritius.
Email: support@tmgm.com
Copyright © TMGM. All rights reserved