

Trading
Explore a wide range of markets with competitive pricing, deep liquidity, and advanced trading tools.
Learn More 
Platform
Trade seamlessly with TMGM's powerful platform, built for speed, precision, and a superior trading experience.
Learn More Trading Platform
Academy
Learn the fundamentals of trading with beginner-friendly resources, including guides, webinars, and market insights.
Learn More News & Analysis
Get real-time market updates and expert analysis to stay ahead of trading opportunities
Learn More News & Analysis
About
Learn what sets TMGM apart — our global presence, regulatory strength, and commitment to innovation in trading.
Learn More Why Choose TMGM
Sponsorship
AUD/USD Price Forecast: Can the pair break out of consolidation near 0.7040?
- A recovering US Dollar pulls AUD/USD back towards 0.7040.
- Hawkish RBA expectations strengthen following elevated Australian CPI readings for Q3 and September.
- Market attention turns to the US flash Q3 GDP release and September PCE inflation figures.
AUD/USD has retreated from a fresh monthly peak of 0.7068 as the US Dollar recovers ahead of key US economic releases. During Thursday’s European session, the Australian Dollar (AUD) is trading near 0.7040 against the US Dollar (USD), down 0.14%. Due at 12:30 GMT are the United States (US) flash Q3 Gross Domestic Product (GDP) estimate and September Personal Consumption Expenditure (PCE) Price Index figures.

Following pressure on Wednesday after the Federal Reserve’s (Fed) monetary policy announcement, the US Dollar Index (DXY) has recovered to around 102.20, up 0.1% at the time of writing. The index measures the Greenback against six major currencies. In its policy decision, the Fed left the Federal Fund Rate unchanged within the 3.75%-4.00% range.
Will US growth demonstrate continued resilience?
TD Securities expects the forthcoming US activity releases to indicate that the economy “will likely show a resilient economy that can handle more restriction.” In the bank’s assessment, “Q3 GDP [will] show robust underlying growth.” On the headline figures, TD Securities observes that “GDP growth picked up in Q3 to 2.5% from 2.2% previously with underlying activity remaining robust,” a view broadly consistent with other forecasts pointing to strong consumption and investment, despite modest drags from components including net exports and inventories.
For the core PCE Index, the Fed’s preferred inflation measure, expectations point to an increase to 3.1% Year-on-Year (YoY), compared with the previous 3% reading.
In Australia, stronger-than-expected Consumer Price Index (CPI) readings for the third quarter and September have increased financial markets’ confidence that the Reserve Bank of Australia (RBA) will raise interest rates at its November policy meeting.
How is Australia’s inflation surprise supporting the Aussie and RBA hike expectations?
The support for the Australian Dollar is highlighted by Brown Brothers Harriman, which says the latest Australian inflation figures “beat expectations, strengthening the case for another RBA hike and underpinning AUD.” According to the bank, “September headline CPI rose 4.3% y/y (consensus: 4.2%) vs. 4.0% in August,” with the upside surprise “reflecting rising housing and transport costs,” adding weight to market pricing for further monetary tightening.
AUD/USD Technical Analysis: Can the Breakout Hold?
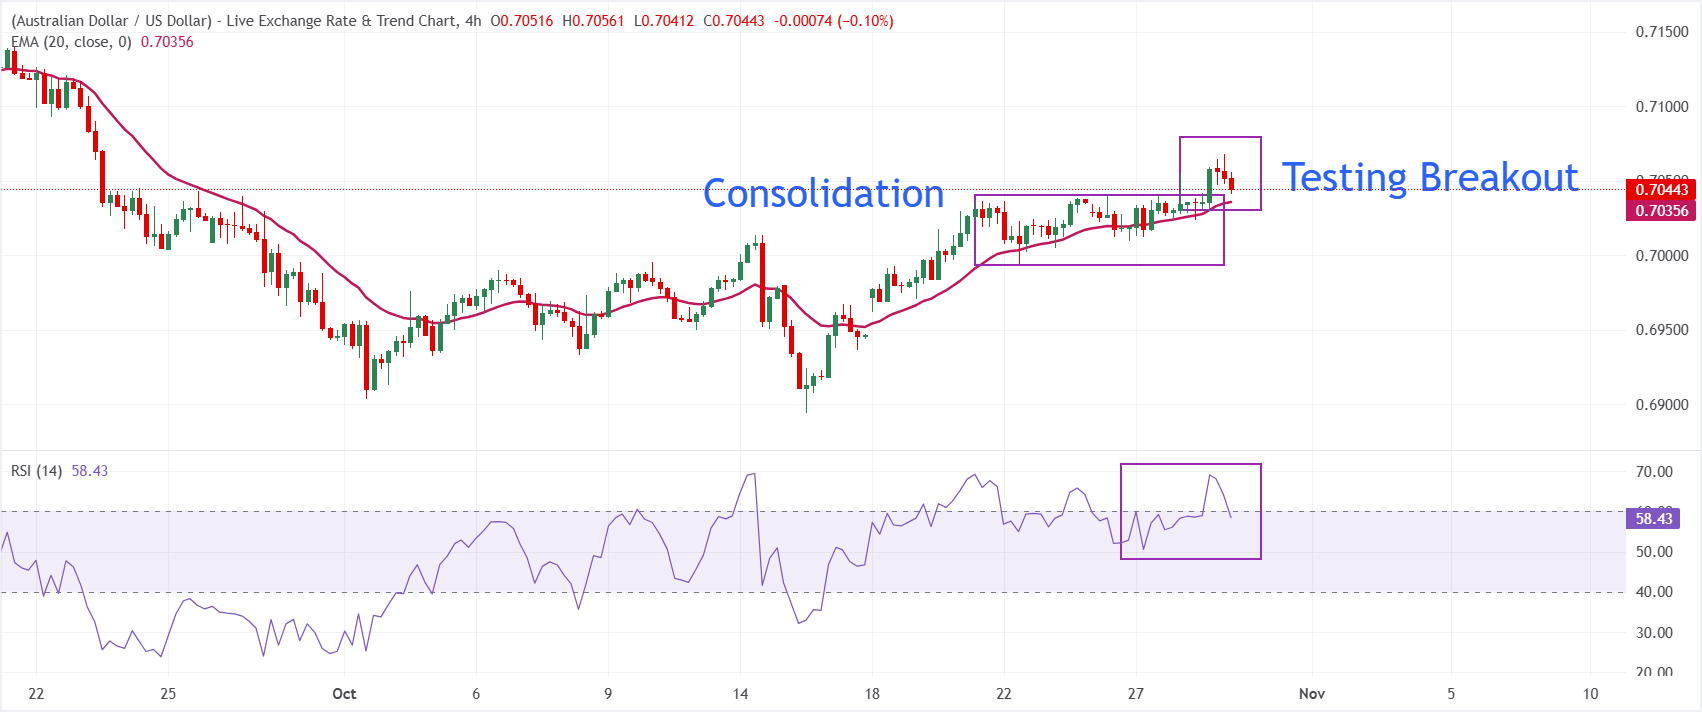
On the four-hour chart, the breakout from AUD/USD’s 0.6994–0.7040 consolidation range is being tested.
Holding above the 20-period Exponential Moving Average (EMA) at 0.7036 leaves the pair with a mildly bullish bias, pointing to underlying buying interest on shallow dips.
At 58, the Relative Strength Index (RSI) signals positive momentum without overbought conditions, maintaining a moderately constructive outlook.
The first downside support lies at the 20-period EMA of 0.7036, followed by 0.6994, the bottom of the previously noted consolidation range. If buyers emerge near the area being tested, the pair would look to build on its gains towards 0.7100.
(The technical analysis of this story was written with the help of an AI tool. Know more.)
Economic Data Indicator
Consumer Price Index: Quarterly Change (QoQ)
Published each quarter by the Australian Bureau of Statistics, the Consumer Price Index (CPI) tracks price movements in a fixed basket of goods and services purchased by household consumers. Averaging the three corresponding monthly CPI readings produces the quarterly CPI data series. The QoQ figure measures prices in the reference quarter against those in the preceding quarter. Markets regard a high reading as bullish for the Australian Dollar (AUD) and a low reading as bearish.
Find out more.Latest release: Wed 28 Oct 2026 00:30
Release frequency: Quarterly
Reported figure: 1.3%
Consensus estimate: 1.3%
Prior reading: 0.6%
Data source: Australian Bureau of Statistics
Markets and the valuation of the AUD are significantly influenced by the quarterly Consumer Price Index (CPI), released by the Australian Bureau of Statistics (ABS). With major implications for monetary policy, this inflation measure is closely monitored by the Reserve Bank of Australia (RBA) as it seeks to fulfil its inflation mandate. Higher consumer prices generally support the AUD, since the RBA could raise interest rates to keep inflation in line with its target. Publication takes place nearly 25 days after the end of the quarter.
POPULAR ARTICLES
1USD/CAD Price Forecast: What lies ahead as the pair trades near 1.4000 within a falling wedge?2Indian Rupee: Range against US Dollar remains intact as RBI maintains hawkish stance – Commerzbank3Will the European Central Bank keep interest rates unchanged as expected despite elevated inflation pressures?4Ahead of ECB, BoJ policy updates, Euro slips against Yen but stays range-bound5Japanese Yen: Trading against US Dollar remains range-bound – UOB6Forex Today: Can ECB and key US data trigger a breakout as major pairs remain range-bound after Fed?7Equities: Hyperscaler earnings leave AI trade gains intact – Danske Bank8Euro consolidates against British Pound after losses: what next ahead of ECB decision?9New Zealand Dollar: Is downside limited following the RBNZ surprise? – OCBC


Get Started!
Sign up and access the Global Markets in less than 3 minutes

Connect With Us









Contacts
Phone: +61 2 8036 8388
Fax: +61 2 8036 8388
Email: support@tmgm.com



The information provided on this website is of a general nature only and does not constitute personal financial advice. Before acting on any information on this website, you should consider the suitability of the information in relation to your objectives, financial situation and needs. Investing in CFDs and FX Margin Contracts carries significant risks and is not suitable for all investors. You may lose more than your initial deposit. You do not own, or have, any interest in the underlying asset. We recommend that you seek independent advice and ensure you fully understand the risks involved before trading. It is important that you read and consider the disclosure document before you acquire any product listed on the website. The information and advertisements offered on this website are not intended for use by any person in any country or jurisdiction where such use would be contrary to local laws and regulations. The Products and Services offered on this website are not intended for residents of the United States, Malaysia and Thailand.
TMGM is authorized and regulated in various jurisdictions.
Trademax Australia Limited, trading as TMGM, is regulated by the Australian Securities and Investments Commission (ASIC), AFSL no. 436416 and is located at Level 28, One International Tower, 100 Barangaroo Avenue, 2000 Sydney, NSW Australia.
Email: support@tmgm.com.au
Trademax Global Limited, trading as TMGM, is authorized and regulated by the Vanuatu Financial Services Commission (VFSC), registration number 40356 and registered at 1276, Kumul Highway, Port Vila, Vanuatu, Republic of Vanuatu.
Email: support@tmgm.com
Trademax Global Markets (SE) Limited, trading as TMGM, is authorized and regulated by the Financial Services Authority (FSA) of Seychelles, with license number SD224. The company is registered at Office No 13, Providence Estate ABIS Centre, Mahe, Seychelles.
Email: support@tmgm.com
Trademax Global Markets (International) Pty Ltd, trading as TMGM, is authorized and regulated by the Financial Services Commission, Mauritius (FSC) with license no. GB22201012, and registered at 33, Edith Cavell Street C/o IQ EQ Fund Services (Mauritius) Ltd Port Louis, 11324 Mauritius.
Email: support@tmgm.com
Copyright © TMGM. All rights reserved