

Trading
Explore a wide range of markets with competitive pricing, deep liquidity, and advanced trading tools.
Learn More 
Platform
Trade seamlessly with TMGM's powerful platform, built for speed, precision, and a superior trading experience.
Learn More Trading Platform
Academy
Learn the fundamentals of trading with beginner-friendly resources, including guides, webinars, and market insights.
Learn More News & Analysis
Get real-time market updates and expert analysis to stay ahead of trading opportunities
Learn More News & Analysis
About
Learn what sets TMGM apart — our global presence, regulatory strength, and commitment to innovation in trading.
Learn More Why Choose TMGM
Sponsorship
USD/JPY Price Forecast: Pair holds near 20-day EMA
- Continued US Dollar weakness pulls USD/JPY lower towards 157.90.
- The continuation of Republican policies is at risk following the US Democrats’ midterm election victory.
- A Fed interest rate hike at the December policy meeting is confidently anticipated by investors.
Selling pressure weighs on USD/JPY on Thursday, with the pair slipping 0.3% to around 157.90 during European trading as the Japanese Yen (JPY) strengthens against the US Dollar (USD). Behind the Dollar’s underperformance are concerns that United States (US) Republicans could struggle to maintain their policies following their midterm election setback against the Democrats.

How Is the US Dollar Performing Today?
The US Dollar recorded its weakest performance against the New Zealand Dollar today. The table below sets out the percentage changes in the US Dollar (USD) against the major currencies listed.
| USD | EUR | GBP | JPY | CAD | AUD | NZD | CHF | |
|---|---|---|---|---|---|---|---|---|
| USD | -0.29% | -0.16% | -0.32% | -0.12% | -0.17% | -0.41% | -0.33% | |
| EUR | 0.29% | 0.13% | -0.05% | 0.16% | 0.12% | -0.14% | -0.06% | |
| GBP | 0.16% | -0.13% | -0.17% | 0.03% | -0.01% | -0.25% | -0.19% | |
| JPY | 0.32% | 0.05% | 0.17% | 0.21% | 0.17% | -0.10% | -0.01% | |
| CAD | 0.12% | -0.16% | -0.03% | -0.21% | -0.04% | -0.30% | -0.22% | |
| AUD | 0.17% | -0.12% | 0.01% | -0.17% | 0.04% | -0.23% | -0.17% | |
| NZD | 0.41% | 0.14% | 0.25% | 0.10% | 0.30% | 0.23% | 0.10% | |
| CHF | 0.33% | 0.06% | 0.19% | 0.01% | 0.22% | 0.17% | -0.10% |
Percentage movements between the major currencies are displayed in the heat map. Select the base currency in the left-hand column and the quote currency in the top row. For instance, choosing the US Dollar on the left and following that row across to the Japanese Yen gives the percentage change for USD (base)/JPY (quote) in the corresponding cell.
At the time of writing, a 0.25% decline has taken the US Dollar Index (DXY) to around 101.24, leaving it near the monthly low of 101.10 recorded the day before. The index tracks the Greenback against six major currencies.
A Democratic sweep would likely “lead to gridlock on the debt ceiling, a prolonged government shutdown next year”, according to analysts at ING. In a further warning, the bank said that “fears of tougher regulation could weigh on Artificial Intelligence (AI) stocks (we’ve recently seen how that can hit the greenback)”.
Attention on the economic calendar is turning to Friday’s release of US Nonfarm Payrolls (NFP) data for October. Investors expect the report to significantly influence expectations for the Federal Reserve’s (Fed) monetary policy.
USD/JPY Technical Analysis: Can the 20-Day EMA Provide Support?
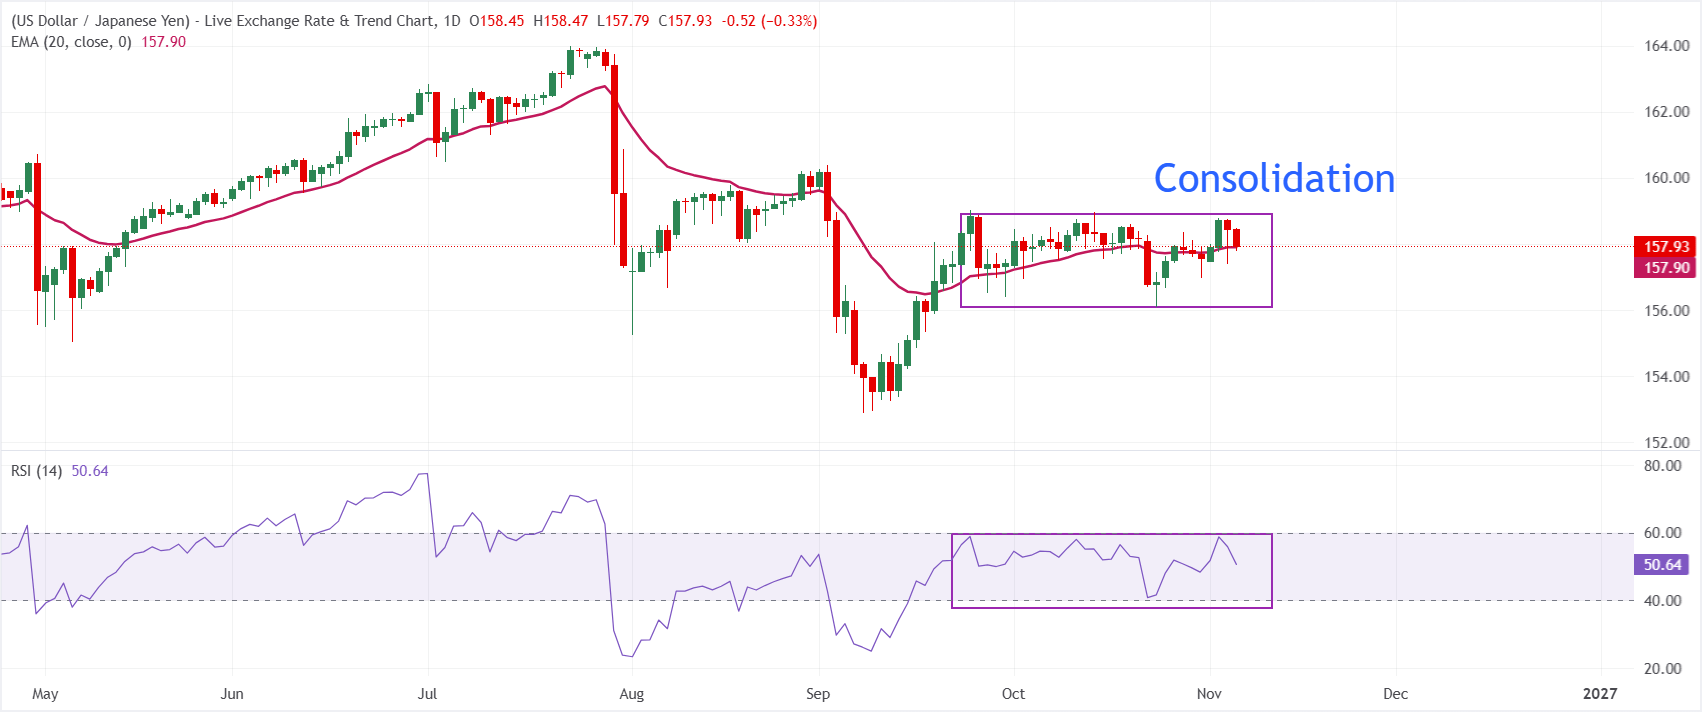
A broadly neutral near-term bias persists as USD/JPY holds close to its 20-day exponential moving average (EMA) of 157.90. On the daily chart, the pair is trading at 157.93.
Neither buyers nor sellers have a clear upper hand for now: the Relative Strength Index (RSI), at 50.66, remains close to its midpoint. This suggests limited directional conviction following the recent swings.
The 20-day EMA around 157.90 offers the first support on the downside. A breach would leave the pair vulnerable to a move towards recent lows should selling intensify. For the upside, the supplied dataset identifies no nearby technical resistance. Traders may therefore watch psychological round-number levels and earlier swing highs above the current price for potential supply that could hinder advances.
(The technical analysis of this story was written with the help of an AI tool. Learn more.)
Which Economic Indicator Is in Focus?
What Do Nonfarm Payrolls Measure?
Published by the US Bureau of Labor Statistics (BLS), the Nonfarm Payrolls report measures new jobs created across US non-agricultural businesses in the preceding month. Payroll changes from one month to the next can fluctuate sharply, and substantial revisions to the figures can also spark volatility in the Forex market. A strong reading is generally viewed as positive for the US Dollar (USD), whereas a weak reading is regarded as negative. However, revisions to earlier months and the Unemployment Rate carry as much relevance as the headline number. The market response consequently reflects its assessment of the BLS report’s full set of data.
Find out more.Next scheduled release: Fri 06 Nov 2026 13:30
Release frequency: Every month
Consensus estimate: 65K
Prior reading: 29K
Data source: US Bureau of Labor Statistics
Substantial market volatility often follows surprises in Nonfarm Payrolls, with readings above consensus generally supporting the USD. This tendency to surprise persists even though several leading indicators help shape estimates. For forex traders, America’s monthly jobs report is regarded as the most important economic indicator. Published on the first Friday after the month under review, it tracks changes in the number of jobs, which are closely linked to the economy’s overall performance and watched by policymakers. With full employment among its mandates, the Federal Reserve takes labour market developments into account when setting policy, thereby influencing currencies.
POPULAR ARTICLES
1USD/JPY Price Forecast: Pair holds near 20-day EMA2Euro: Is 1.1280 key to a positive outlook against US Dollar? - UOB3Hopes of an end to Iran war fuelled by midterm elections send WTI tumbling below $86.504How is stronger-than-expected Q3 GDP lifting the Indonesian Rupiah?5Are US Dollar weakness and inflationary pressure driving Swiss Franc gains?6Indian Rupee gains further as US Dollar weakens and oil prices fall7British Pound weakens against Japanese Yen as BoE policy decision approaches8GBP/USD Price Forecast: Bias remains bullish ahead of BoE decision as key support holds9Monthly lows near 101.00 for United States Dollar Index in wake of Democratic sweep


Get Started!
Sign up and access the Global Markets in less than 3 minutes

Connect With Us









Contacts
Phone: +61 2 8036 8388
Fax: +61 2 8036 8388
Email: support@tmgm.com



The information provided on this website is of a general nature only and does not constitute personal financial advice. Before acting on any information on this website, you should consider the suitability of the information in relation to your objectives, financial situation and needs. Investing in CFDs and FX Margin Contracts carries significant risks and is not suitable for all investors. You may lose more than your initial deposit. You do not own, or have, any interest in the underlying asset. We recommend that you seek independent advice and ensure you fully understand the risks involved before trading. It is important that you read and consider the disclosure document before you acquire any product listed on the website. The information and advertisements offered on this website are not intended for use by any person in any country or jurisdiction where such use would be contrary to local laws and regulations. The Products and Services offered on this website are not intended for residents of the United States, Malaysia and Thailand.
TMGM is authorized and regulated in various jurisdictions.
Trademax Australia Limited, trading as TMGM, is regulated by the Australian Securities and Investments Commission (ASIC), AFSL no. 436416 and is located at Level 28, One International Tower, 100 Barangaroo Avenue, 2000 Sydney, NSW Australia.
Email: support@tmgm.com.au
Trademax Global Limited, trading as TMGM, is authorized and regulated by the Vanuatu Financial Services Commission (VFSC), registration number 40356 and registered at 1276, Kumul Highway, Port Vila, Vanuatu, Republic of Vanuatu.
Email: support@tmgm.com
Trademax Global Markets (SE) Limited, trading as TMGM, is authorized and regulated by the Financial Services Authority (FSA) of Seychelles, with license number SD224. The company is registered at Office No 13, Providence Estate ABIS Centre, Mahe, Seychelles.
Email: support@tmgm.com
Trademax Global Markets (International) Pty Ltd, trading as TMGM, is authorized and regulated by the Financial Services Commission, Mauritius (FSC) with license no. GB22201012, and registered at 33, Edith Cavell Street C/o IQ EQ Fund Services (Mauritius) Ltd Port Louis, 11324 Mauritius.
Email: support@tmgm.com
Copyright © TMGM. All rights reserved